

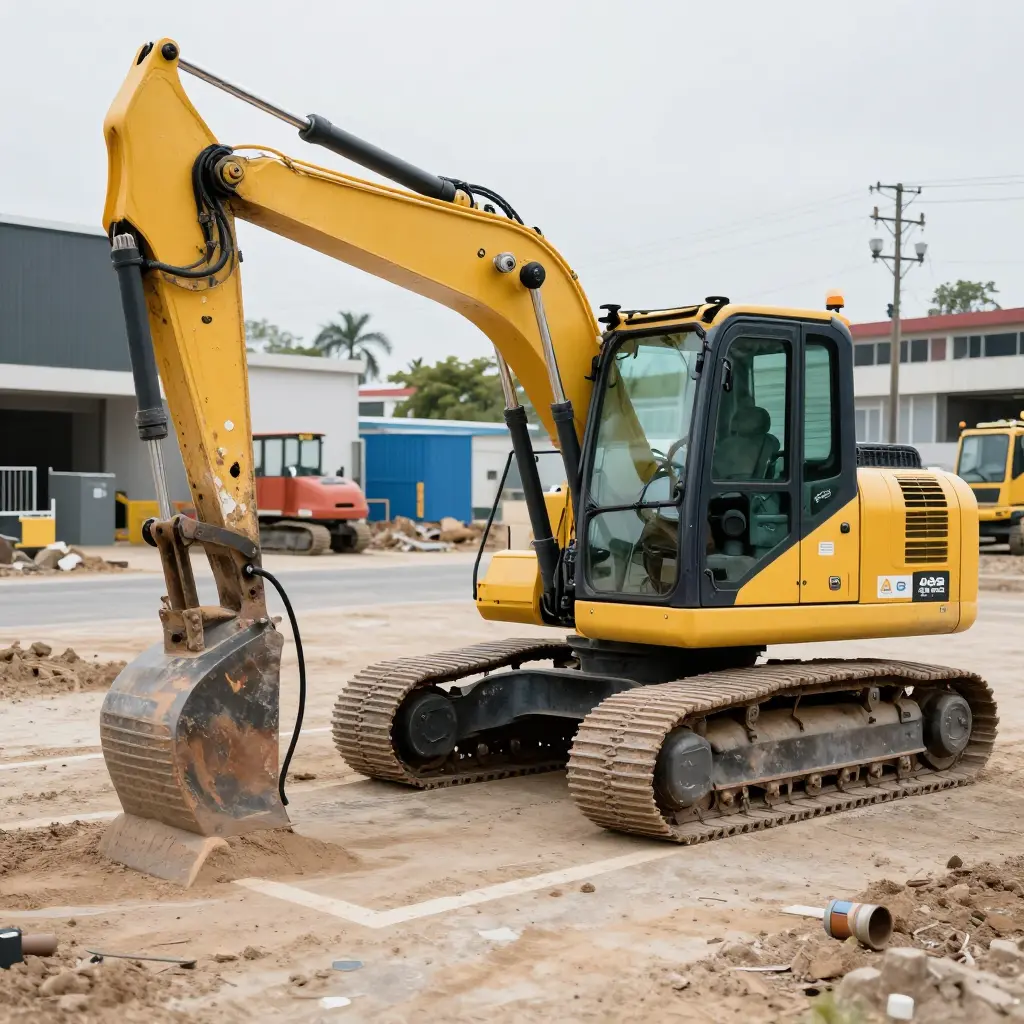
Electric Excavator Charging Windows on Urban Job Sites: The Grid Connection Cost Planners Miss
Electric excavator charging windows decide how a zero-emission earthmoving fleet actually runs inside a city block. A charging window is the scheduled block of time an excavator spends plugged into a power source, drawing energy until its battery reaches the state of charge the next shift needs. That block is not the same as the time the machine happens to sit parked. It is a constraint: how much work the machine can do is tied directly to how much electrical capacity the site has.
For the planner or project manager budgeting a job, grid connection cost is the line item that gets missed. Upgrading a utility service, running a dedicated feeder, or installing a transformer for overnight charging can cost more than the excavator itself. It seldom shows up in early planning documents, yet it decides whether a charging window exists at all.
Why Urban Job Sites Play by Different Rules
A remote quarry or highway project usually has room for a large charging pad, a standalone substation, and a slow, flexible schedule. An urban site is hemmed in by existing buildings, limited service capacity, permit restrictions, and access or noise rules that shorten even the hours when charging is allowed. The window is narrower, peak demand is higher, and missing the window stops work the next morning. Cold weather can shrink it further: battery thermal derating in subzero conditions cuts into usable capacity, particularly on winter projects.
The Cost Categories Behind a Charging Window
Charging-window problems come down to a handful of cost categories, and teams can plan against them before the machines arrive. The main ones:
- Utility service upgrades and new service connections
- Transformer, switchgear, and panel costs
- Cabling, trenching, and pad construction
- Time-of-use energy pricing and demand charges
- Onboard charger limits that cap how fast a battery can accept power
Each category answers the same planning question: does the site have the power to open the charging window at all?
How Charging Windows Work on Urban Job Sites
On an urban job site, machines do not run around the clock, and neither can their chargers. A charging window is the block of time when electric construction equipment can draw power without stalling work or overloading the local grid. Site power planning is mostly the work of getting these windows right.
Duty Cycles Set the Energy Demand
Every machine runs a duty cycle: the repeating pattern of work and rest it performs in a day. A mini excavator might dig for 40 minutes, idle for 10, then repeat across two shifts. Multiply that pattern by the machine’s power draw and you get a daily energy demand you can predict. Duty cycle is the first input to any charging schedule, because it tells you how much energy the battery has to recover between work blocks.
Battery Capacity and Charge Duration
Charge duration is arithmetic: battery capacity in kilowatt-hours divided by charger output in kilowatts. A 200 kWh pack on a 50 kW charger needs roughly four hours of continuous charging. Bigger packs or smaller chargers stretch that number, which is why the available window usually dictates the charger size a site installs.
Daily Schedules Create Discrete Charging Windows
The work calendar carves the day into openings. Shift handovers, lunch breaks, and the overnight shutdown all create pauses when machines sit idle and can be plugged in. On a tightly scheduled urban site, the longest reliable window is usually overnight, often eight to ten hours; midday gaps may offer only two or three.
Peak vs Off-Peak Timing
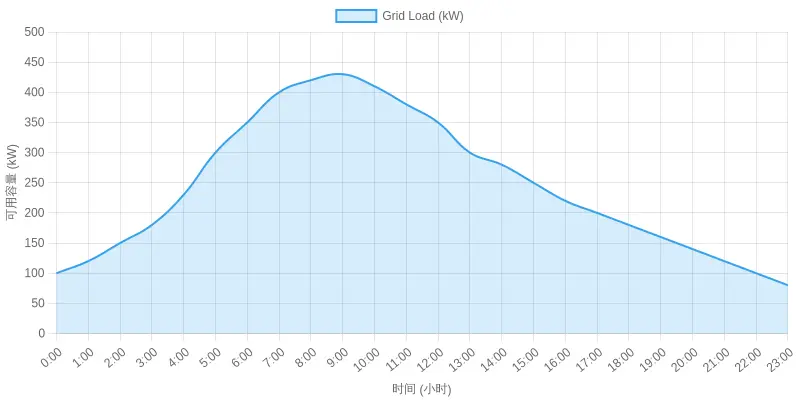
Utilities price and constrain power differently across the day. Off-peak hours, typically late evening through early morning, bring lower demand charges and more headroom, which makes them the best time for bulk charging. During peak periods, often late afternoon into the evening, supply tightens and costs rise, so heavy draws are better avoided or postponed.
Grid Capacity Sets the Ceiling
How many machines you can charge at once is capped by the site’s available grid capacity. If a connection supplies 500 kW and each charger pulls 50 kW, ten units is the practical maximum at any moment, and that limit shrinks as peak demand rises.
Seasonal Derating Trims Usable Capacity
Cold weather reduces the usable capacity of lithium-ion packs, so a window that works in summer may fall short in winter. Allow a planning margin for that loss and urban schedules stay realistic year-round. How low temperatures affect runtime is covered in this guide to battery thermal derating in electric loaders at subzero sites.
Grid Connection Cost Components for Electric Excavator Charging
A grid connection for electric excavator charging is rarely one line item. It bundles upgrades, equipment, and ongoing fees split among the planner, the contractor, and the utility. The table separates those components so teams can budget realistically, assign responsibility, and see which items tend to surface late in construction.
| Cost Component | What It Covers | Typical Cost Driver | Who Owns the Risk (Planner / Contractor / Utility) |
|---|---|---|---|
| Utility Service Upgrade | Increasing the incoming service capacity so the site can carry the charger load without tripping shared infrastructure | Peak kW of the charger cluster and distance to the nearest feeder with headroom | Utility (execution) / Planner (trigger and timing) |
| Transformer Installation | Dedicated transformer, vault or pad, and secondary connections sized for the charging block | Transformer kVA rating, pad-mount vs. vault, and utility lead times | Utility / Planner |
| Trenching and Cabling | Excavation, conduit, conductors, and surface restoration from the service point to the charger pad | Trench length, soil and rock conditions, and curb/sidewalk restoration rules | Contractor |
| Switchgear and Protection | Main switchboard, breakers, relays, fault protection, and disconnects | Fault-current ratings, redundancy, and enclosure specifications | Contractor (design-build) / Planner (specification) |
| Demand Charges | Ongoing utility fees billed on peak kW demand rather than energy consumed | Coincident peak load, demand ratchet clauses, and time-of-use rate structure | Planner (operational discipline) |
| Permitting and Engineering Fees | Electrical drawings, load studies, permits, inspections, and utility interconnection applications | Jurisdiction complexity, engineering hours, and review timelines | Planner |
| Metering and Monitoring | Sub-metering, telematics hardware, and network or data fees for charge tracking | Reporting requirements and utility metering rules | Planner |
The rows teams miss most often are demand charges and permitting and engineering fees. Demand charges stay invisible in a construction budget because they arrive on the monthly utility bill, but one unmanaged peak can reshape lifecycle costs. Permitting and engineering fees get skipped because they look like paperwork rather than a schedule-critical workstream, and interconnection reviews can stall a charging window for months. Utility service upgrades catch planners off guard for a different reason: the lead time, not the price.
Demand Charges and Peak Load Management
Electric equipment is not only a kilowatt-hour story. Demand charges are fees based on a site’s highest 15- or 30-minute power draw in a billing period, and on commercial and industrial accounts they often make up 30% to 50% of the bill. On an urban site, one badly timed spike can dominate the whole grid connection cost.
How demand charges and time-of-use rates interact
Time-of-use (TOU) rates divide the day into on-peak and off-peak periods, each with its own price per kilowatt-hour. Demand charges sit on top of that energy price and capture the maximum power you reach, not the total energy you consume. So a single high-power session inside an on-peak period can set a high demand charge for the whole month, even if the rest of the month runs smoothly.
Load factor and coincident peak
Load factor measures how evenly a site uses power over time: total energy divided by peak demand and by the hours in the period. A low load factor means spiky, expensive usage. Coincident peak is the moment a site’s maximum draw lands at the same time the wider grid is most stressed. Utilities price coincident peaks aggressively because that is when their own costs spike.
Shifting charging into off-peak windows
Moving charging into off-peak windows lowers cost twice over: cheaper energy per kilowatt-hour and lower coincident peaks. Because demand charges track the single worst interval, spreading or delaying a session is often worth more than the energy-price saving alone.
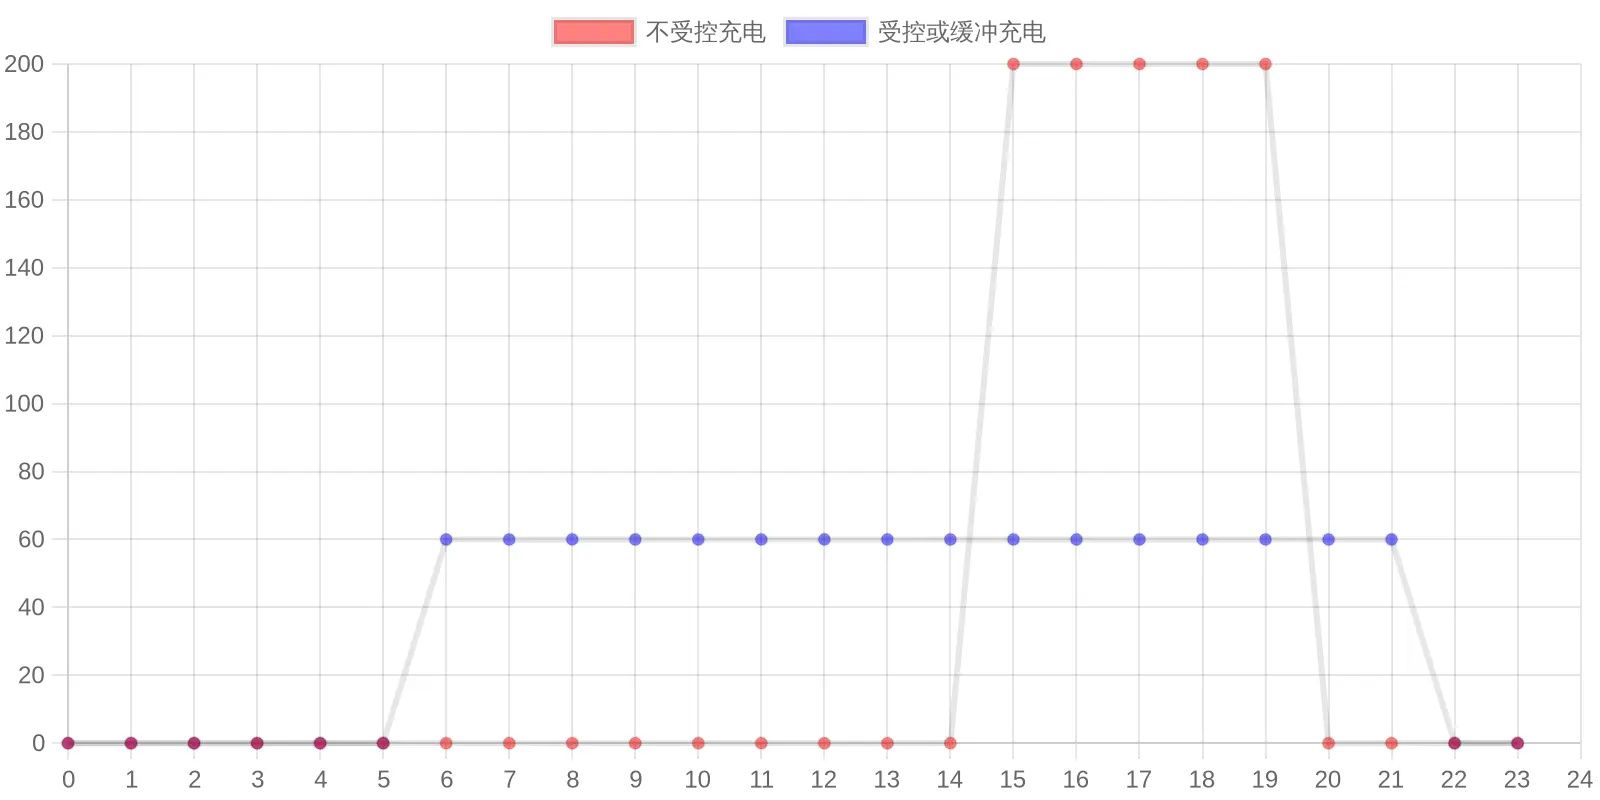
Controlled or buffered charging, where software throttles or stages the power sent to each vehicle, can reduce the grid connection capacity a site needs. A site that would otherwise require a large service upgrade can connect with a smaller, cheaper feed and still meet the same daily charging demand.
Why it matters for planners
For planners and project managers the point is to design charging windows and controls before the utility service is sized. Flattening the peak load protects the budget. Since battery performance shifts with temperature, the same design also has to hold up across the seasons.
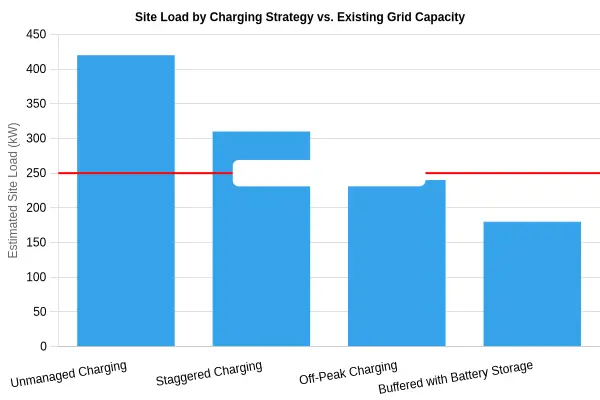
Site Load by Charging Strategy vs. Existing Grid Capacity
The chart compares estimated site load, in kW, for four charging strategies against an existing grid connection capacity of 250 kW. Each bar is one strategy; the horizontal reference line marks where the site starts pulling more power than the utility connection can deliver.
- X-axis: Charging Strategy
- Y-axis: Estimated Site Load (kW)
- Reference line: Existing Grid Capacity (250 kW)
- Datasets: Unmanaged Charging (420 kW), Staggered Charging (310 kW), Off-Peak Charging (240 kW), Buffered with Battery Storage (180 kW)
What the Numbers Tell You
| Charging Strategy | Estimated Site Load (kW) | Position vs. 250 kW Capacity |
|---|---|---|
| Unmanaged Charging | 420 | Over capacity by 170 kW |
| Staggered Charging | 310 | Over capacity by 60 kW |
| Off-Peak Charging | 240 | 10 kW of headroom |
| Buffered with Battery Storage | 180 | 70 kW of headroom |
Only the two managed strategies leave real capacity headroom. Unmanaged charging runs 170 kW past the existing connection, which leaves a choice between a costly service upgrade and demand-limiting controls. Buffering with on-site battery storage keeps load well below the threshold even before peak shaving.
How you sequence charging windows matters more than which chargers you buy. Scheduling plus buffering can hold a site inside the headroom its connection already provides; unmanaged charging is the likeliest reason a project triggers a grid upgrade nobody budgeted for.
Site Power Planning and Infrastructure Layout
Site power planning on an urban job is less about choosing a charger than about fitting an electrical system into a space that was never designed to hold one. Every mover, hoarding panel, and delivery lane competes for the same few square meters, so layout has to be settled early. Get the geometry right and electric excavator charging becomes routine; get it wrong and the power feed sits idle while crews wait.
Siting the Chargers
Because urban sites rarely offer open ground, chargers usually sit on compact pads tucked against the hoarding, beside the laydown yard, or on the apron of a washout bay. Point connector panels toward where the excavator parks, to keep cable runs short and trip hazards down. Where there is no yard at all, mount wall boxes on a temporary power cabinet that can move as the excavation front advances.
Cabling Routes and Right-of-Way
Cable routing is often the hidden cost. Trenching across a public sidewalk can require a right-of-way permit, traffic control, and reinstatement, each of which stretches lead times. Over active roadways, overhead spans on catenary wire are usually easier; where trucks roll, short surface ducts under rubber ramps do the job. A well-documented route also eases utility approvals later.
Transformer Placement and Clearances
A pad-mounted transformer needs code-required working space, typically around 0.9 to 1.2 m of clear access plus ventilation. Keep it out of vehicle swing paths but close enough to the charger to hold voltage drop within limits. Confirm grid connection capacity before ordering equipment: an undersized service can force an upgrade that delays the whole program.
Phasing and Charging Windows
Construction is never static. A phased layout, with stub-outs to future pad locations, portable switchgear, and a temporary service sized for phase one, lets charging windows move with the dig. Coordinating those windows with quiet hours and lane closures keeps the site compliant and the excavators charged.
For fleets, matching this infrastructure to the vehicles that will use it is half the battle. Custom municipal truck builds follow the same planning logic.
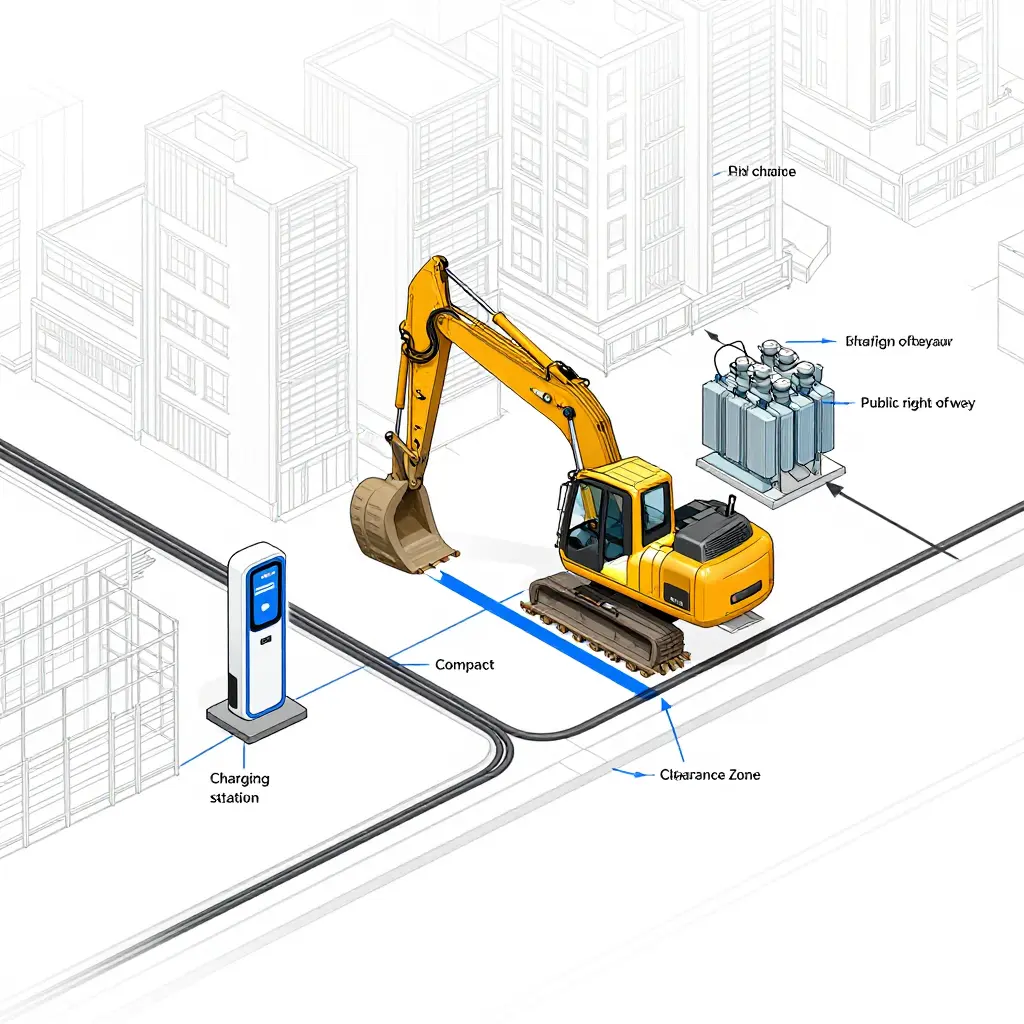
The diagram follows the grid connection pathway from left to right: the utility feed supplies power, a transformer steps it down, switchgear provides protection and control, and the charger delivers it to the excavator. Every link in that chain is a point where cost, capacity, or permitting can stall an urban job. Planning realistic charging windows starts with understanding the chain, and with knowing how the equipment behaves in the cold, as this guide to battery thermal derating in electric loaders at subzero sites explains.
Practical Steps to Size and Budget a Charging Window Setup
Whether you are retrofitting one machine or electrifying a whole fleet, these steps keep technical scope and budget moving together.
- Tally the daily load first: add up the kilowatt-hours each excavator consumes and size around real duty cycles, not nameplate ratings.
- Map charging windows against shift patterns: find the idle blocks when machines can plug in without pausing production.
- Bring the utility in early: pre-application coordination surfaces transformer upgrades and capacity limits that can reshuffle the timeline.
- Right-size the chargers: match output to fleet turnover so you are not paying for power you rarely use.
- Pick a phasing strategy: staggering installations spreads capital spend and lets each phase inform the next.
- Build the full cost model, grid connection cost included: leaving that line item hidden to the end is the surprise planners regret most.
- Stress-test the numbers, then add contingency: reserve 15-20% for permitting delays, feeder upgrades, and cold-weather derating that cuts winter charging capacity.
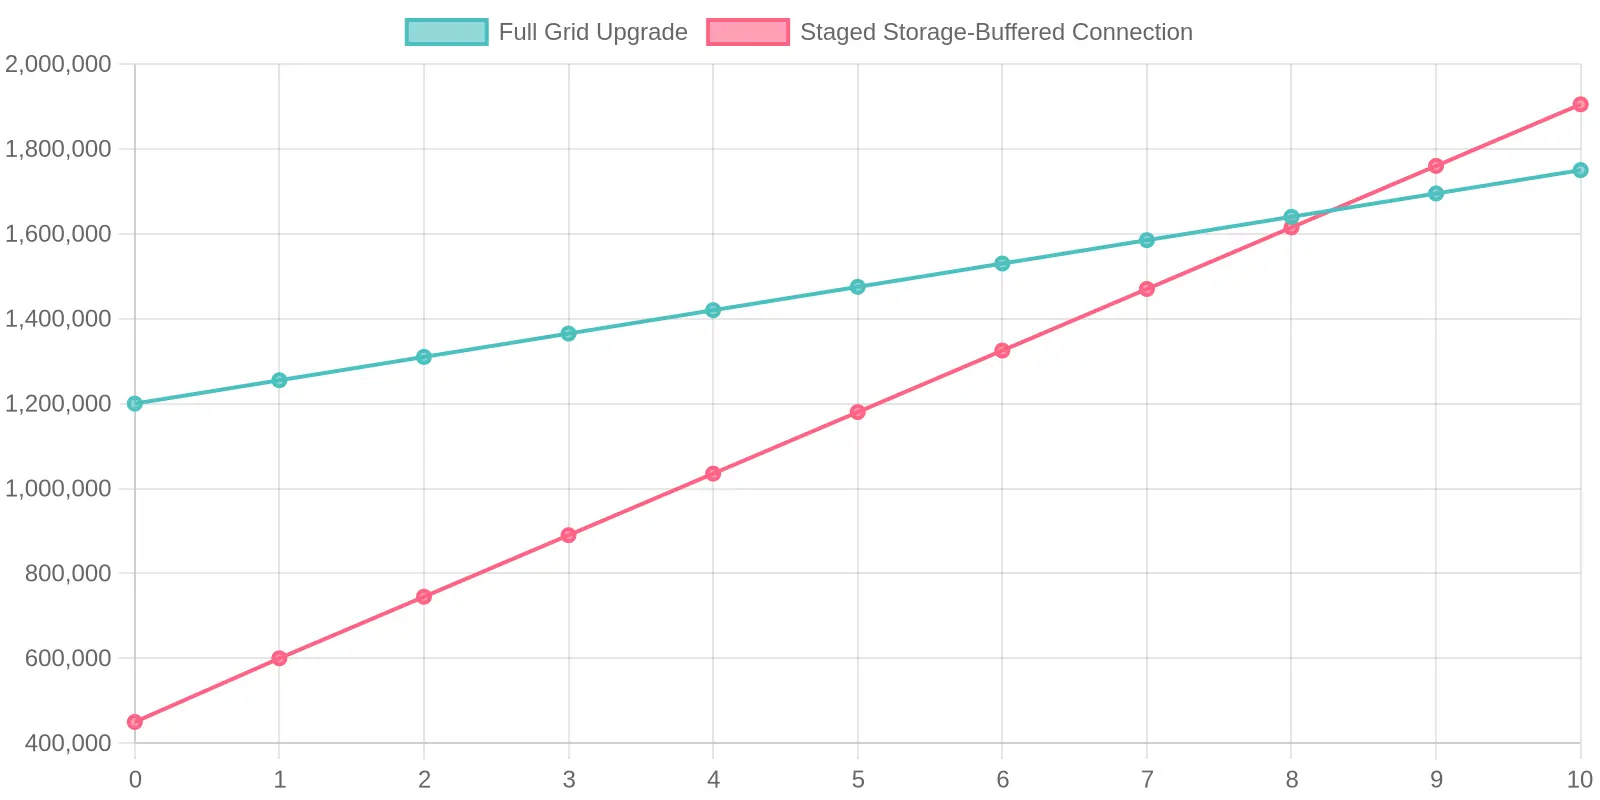
The cost crossover: when the cheap option stops being cheap
At year zero the staged, storage-buffered connection looks unbeatable: roughly $750,000 below a full grid upgrade, because it defers the heavy transformer and service-entrance spend. Its operating and demand-charge load is steeper, about $145,000 a year against $55,000 for the upgraded grid, and that gap erodes the lead until the two lines cross around year 8 or 9. After the crossover the full upgrade is cheaper over the asset’s life, so the question is not which connection costs less today but how many years the site will actually be charging electric machines. For a decades-long fleet commitment, also account for how cold weather saps battery output and reshapes charging demand.
Permitting, Utility Coordination, and Timeline Risk
Planners routinely model battery capacity and charger output, then treat the grid connection as a switch that flips on the day the machines arrive. It is usually the slowest-moving part of an electric excavator deployment. Utility interconnection is not a single form but a queue: a feasibility study, a system impact review, then an executed service agreement, all before a single kilowatt reaches the site. On constrained urban feeders that sequence alone can stretch from 12 to 24 months.
Equipment lead times compound it. High-capacity transformers and medium-voltage switchgear are mostly built to order, and delivery windows currently run 40 to 80 weeks. A project can have cured concrete and a finished trench while the power room sits empty, waiting on hardware that has not left the factory.
Those timelines collide with construction schedules. Crews count on overnight and shift-change charging so machines are ready at dawn, but when the permanent service slips, teams fall back on temporary generators or undersized connections. Charging windows compress, and machines are more likely to be short on charge at the start of a shift.
Seasonal assumptions deserve the same scrutiny. Cold-weather behavior, including battery thermal derating that trims usable capacity in freezing conditions, should feed straight into winter reserve calculations. On urban sites with tight footprints and no spare feeder capacity, those margins vanish fast.
The fix is sequencing: pull permitting and interconnection to the front of the program, buy long-lead electrical gear first, and size charging windows against real seasonal data rather than optimistic averages.
Frequently Asked Questions
Planners, project managers, and electrical engineers electrifying urban sites run into the same handful of questions.
What is an electric excavator charging window?
It is the block of time a machine can be plugged in without disrupting the work schedule. Because electric excavators carry large battery packs, these windows usually line up with lunch breaks, shift changes, or overnight downtime. Defining them correctly determines how much power a site draws and when that demand peaks.
Why are grid connection costs so often underestimated?
Planners focus on the charger’s purchase price and overlook the utility-side work needed to deliver power. Upgrading a transformer, running new service lines, and paying for capacity studies can easily dwarf the equipment budget. Engaging the utility early is the only reliable way to get a realistic connection cost before budgets are locked and equipment is ordered.
How are demand charges calculated?
They are based on the highest average power a site draws over a short interval, typically 15 minutes, during a billing period. The utility measures that peak in kilowatts and multiplies it by a rate, so one spike can set the charge for the whole month. Scheduling charging windows to avoid simultaneous high-power draws is among the most effective ways to control them.
Can battery storage reduce the connection size I need?
Yes. Instead of pulling the full charging load from the grid at once, a battery buffers energy and releases it to the chargers, leveling the peak. That lowers both the required service capacity and the demand charges tied to it. Battery performance varies with temperature, so understand how battery thermal derating affects electric loaders before sizing a system.
How long do utility upgrades take?
Commonly six to twenty-four months, depending on scope and the condition of the local grid. Simple service upgrades can move faster; new transformers or substation work can take well over a year. That timeline is why charging-window planning and grid studies belong in project design, not after the equipment arrives.
Who should be involved in the planning process?
The utility, the electrical engineer, and the site manager, together, before the first charger is specified. Each holds a piece of the picture: available capacity, load timing, daily work flow. Combined early, they produce a smaller, cheaper connection design that is far less likely to stall the job.
What Planners Should Do Next
On urban job sites, the grid connection cost of electrifying excavators is not a footnote, and charging windows are not an afterthought. Both belong on the agenda of the first feasibility meeting.
Put grid connection cost in the budget as a first-class line item, alongside purchase price and maintenance: utility service extensions, transformer upgrades, and interconnection fees belong in the same spreadsheet as the machines. Design charging windows early, too, mapping them against shift schedules, peak-demand periods, and the thermal limits described in our guide to battery thermal derating in electric loaders, well before the site layout is finalized.
The categories and planning steps, in one view:
| Category | What it includes | Planning step |
|---|---|---|
| Grid connection cost | transformer upgrades, service extensions, utility fees | run a utility coordination and load study first |
| Charging infrastructure | chargers, cabling, protection equipment | match charger ratings to fleet size |
| Energy and demand | consumption, peak-demand charges | schedule charging windows off-peak |
| Site productivity | downtime, thermal derating | align charging with work cycles |
As urban job sites electrify over the coming decade, the planners who budget grid connection cost and schedule charging windows from day one will avoid the delays and overruns that come from treating both as late-stage details.