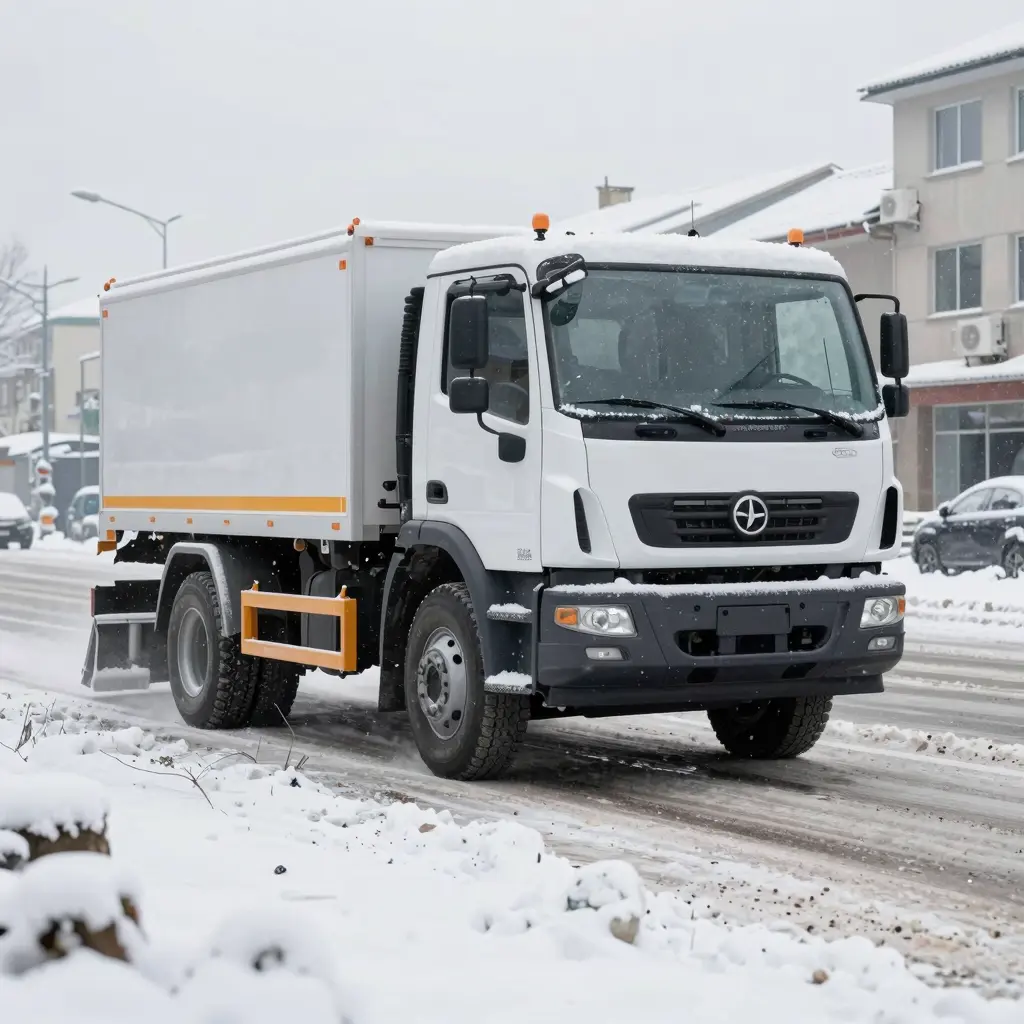


The Hidden Line Item: How Spread Pattern Error Drains Your City Salt Budget
Every winter, public works directors approve a salt budget around two numbers they cannot control: the price of rock salt and how bad the season turns out to be. Telematics from winter maintenance fleets points to a third driver, one that is controllable. The largest controllable cost is neither procurement nor weather. It is salt spreader calibration – the gap between the application rate a controller is set to and the material that actually leaves the spinner.
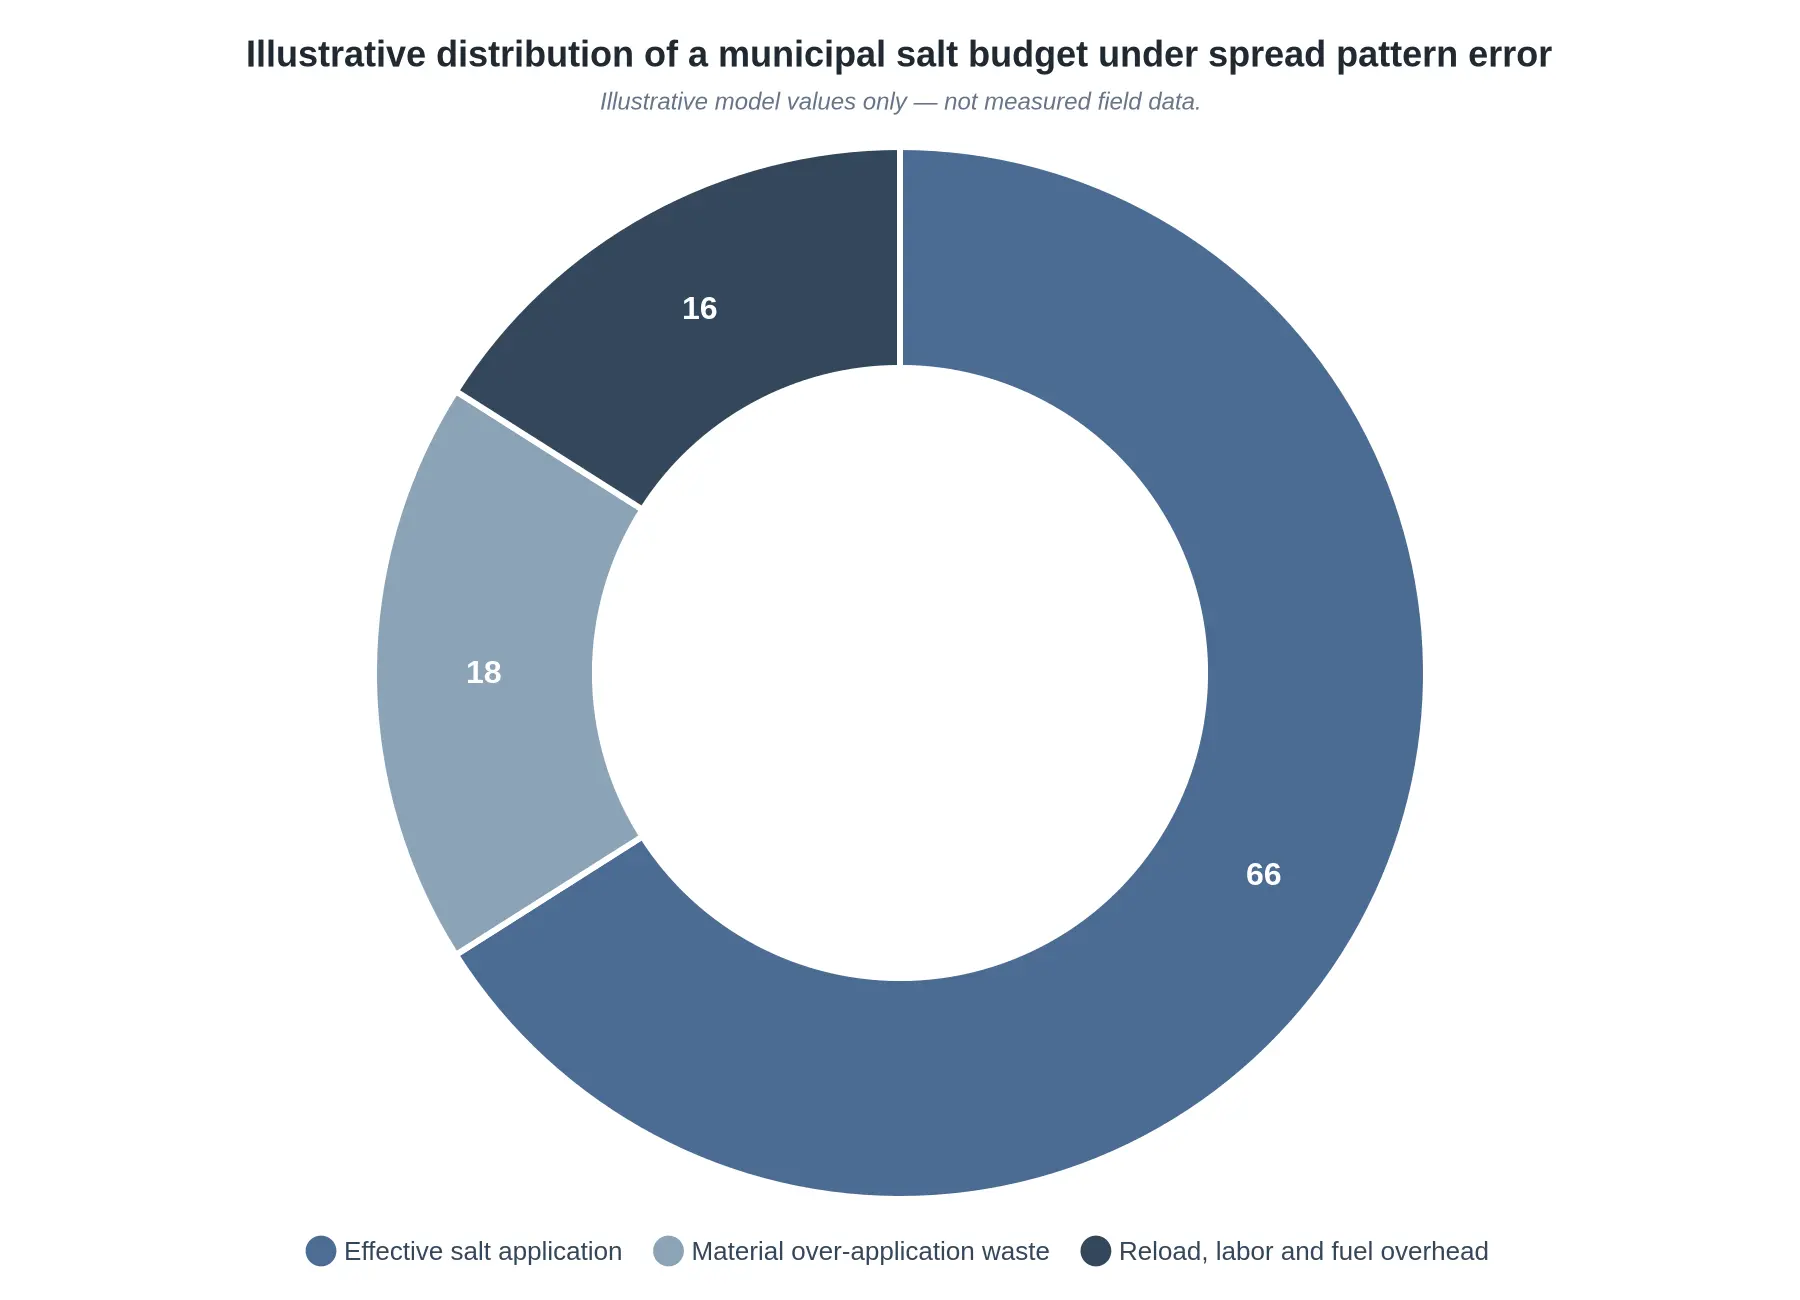
That gap is what we call spread pattern error. When it is present, a municipal snow plow truck puts salt down at the wrong concentration, over the wrong width, or both. The route still logs normally, the operator still sees a spinner turning, and the board still gets a plausible tonnage number. Nothing looks broken, but the coverage is uneven and the truck is using more salt than the road needs. Agencies that audit their spreader patterns commonly trace somewhere near a third of a city salt budget to over-application and the extra reloads it forces, rather than to actual de-icing need.
Why Calibration Drift Escapes Detection Across a Fleet
The leak persists because of how spreaders fail, not because crews are careless. Calibration drifts the way brake pads wear – gradually, and without any single moment you would notice:
- Drift is incremental. Auger wear, hydraulic variance, and moisture in the hopper move output by a few percent a season, so no one day looks wrong.
- There is no acute failure event. A miscalibrated spreader never throws a fault code, so it never generates a work order.
- Operators compensate instinctively. Crews adjust speed and gate settings by feel, which hides the miscalibration instead of exposing it.
- Reporting tracks tonnage, not pattern. Budget dashboards show how much salt was used, never how evenly it landed.
Across a fleet and a full season, those small errors add up to six- and seven-figure overspend. Fixing them starts with understanding the machine.
What This Article Covers
- How spread pattern error is measured and benchmarked against target application rates.
- The fleet-wide audit process for spotting miscalibrated units before the season starts.
- A cost model that turns a calibration correction into recovered salt budget.
- Preventive maintenance intervals that keep spreaders accurate through peak storm cycles.
For the wider equipment and operations context, see our overview of efficient snow removal technologies for municipal fleets. The rest of this article moves from diagnosis to a repeatable, measurable calibration program.
Inside the Machine: How a Municipal Salt Spreader Actually Works
A municipal salt spreader does two jobs in sequence: it meters material and it throws it. Salt sits in the hopper, gravity pulls it toward the floor, and a hydraulically driven auger or chain conveyor drags it rearward. An adjustable steel plate – the gate – sets the aperture the material has to squeeze through. From there it drops onto a spinning disc and is flung across the pavement.
Everything downstream depends on the feed. If material reaches the spinner at an uneven rate, the pattern will be uneven, and no amount of spinner tuning will correct it.
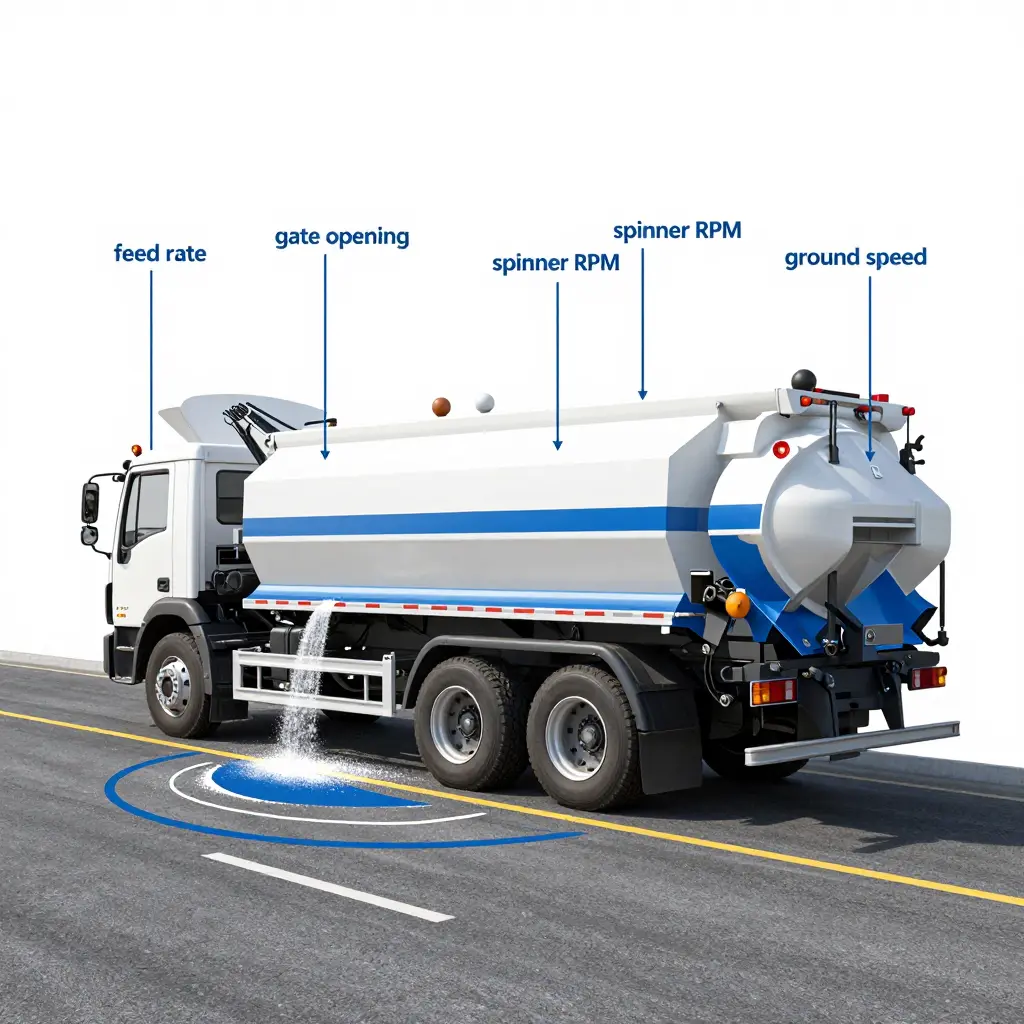
The Feed Side: Auger, Conveyor, and Gate Opening
The auger or conveyor sets the volumetric feed rate: how much material crosses a fixed point per unit of time. The gate opening sets how deep a bed the auger can carry. Open the gate and feed rate climbs; close it and the conveyor starves. Because the two variables interact, a proper feed-rate calibration fixes the gate position first, then weighs the output over a timed interval.
The Spinner: RPM and Spread Geometry
The spinner turns feed into geometry. Spinner RPM sets the exit velocity of each particle: higher RPM throws material farther and flatter, lower RPM drops it closer to the truck. Fin width, disc diameter, and blade pitch decide whether the stream lands as a narrow ribbon or a wide fan.
Ground Speed and Material Density
Ground speed converts a fixed mass per minute into an application rate per lane-mile. Hold the feed steady and double your speed, and you halve the rate per mile. Material density complicates it further: a volumetric feeder measures volume, not weight, so dry treated salt, sand-salt blends, and pre-wet mixes all deliver very different mass at the same gate and auger setting.
What Calibration Actually Measures
Calibration is not a single adjustment. It is a set of verified relationships, and a complete salt spreader calibration captures five of them:
| Variable | What It Controls | How It Is Verified |
|---|---|---|
| Auger/conveyor feed rate | Mass delivered per minute | Timed catch test, weighed |
| Gate opening | Depth of material bed | Physical measurement / stop setting |
| Spinner RPM | Throw distance and pattern width | Tachometer reading |
| Ground speed | Application rate per lane-mile | GPS or calibrated speedometer |
| Material density | Volume-to-mass conversion | Bulk density sample, kg/m3 |
Only when all five are known can a controller calculate the correct setting for a target application rate. Change one – a denser mix, a new spinner, a rebuilt hydraulic motor – and the calibration is void.
Spread Pattern Error: The Gap Between Intent and Reality
Spread pattern error is the gap between the distribution a controller intends and the distribution that actually lands across the lanes. A controller might command a uniform 30 g/m2 across five lanes, while wear, wind, gate drift, and a mismatched spinner RPM pile material in the center and starve the shoulders.
The chart below shows a common failure: even intent, lopsided result.
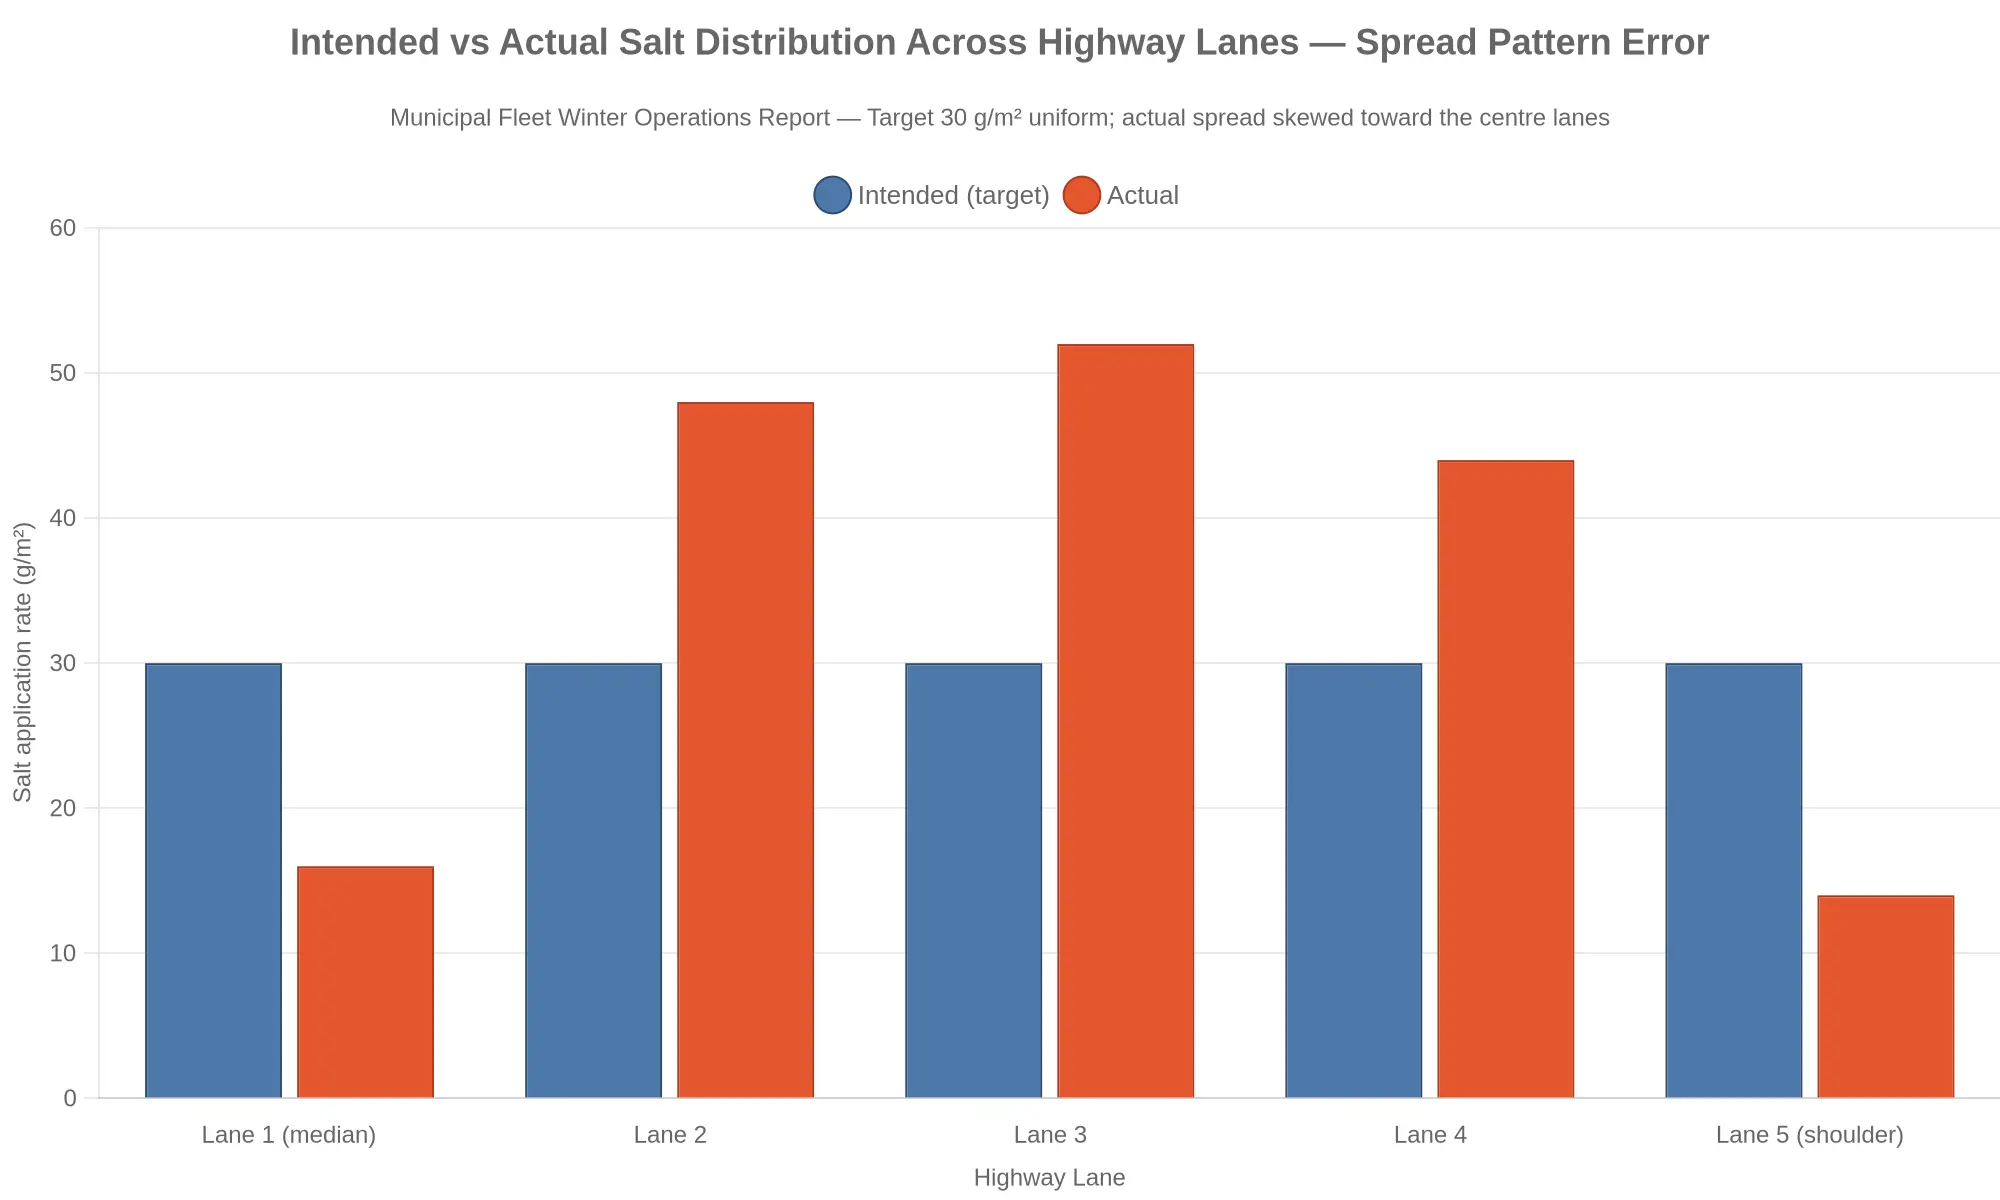
The consequences run in both directions. Salt piled in the center is wasted and corrodes infrastructure; thin coverage at the edges leaves untreated pavement and exposure to liability. That is why spread pattern verification – catching material in a grid of pans at a set distance – matters as much as bench-testing feed rate. It is also why fleets investing in efficient snow removal technologies treat calibration as recurring operational work rather than a one-time setup.
Why This Quietly Burns Budgets
A pattern that is 30 percent too heavy in the center lanes does not announce itself. It simply takes more tons per mile, more driver hours, and more maintenance, until the seasonal salt budget is gone well before the last storm. Measuring feed rate, spinner RPM, gate opening, ground speed, and material density, then checking the pattern on the pavement, is the difference between spreading salt and spreading money.

How to read the geometry of a spreader pattern. The panel on the left shows the goal. Material leaves the spinner in a symmetric wedge, so the same mass lands across each unit of lane width, and a truck moving at a steady 25-30 mph lays down a uniform application rate over both lanes. The panel on the right shows the failure that quietly drains a snow budget. The distribution skews, dumping a heavy concentration on one side of the footprint and leaving a starved, under-treated strip on the other. The load ticket still shows a normal tonnage per mile, so nobody notices the imbalance until the icy complaint calls start coming in from the thin side of the road.
Even a modest skew gets expensive. A swath that runs heavy on one side pushes the operator to widen the setting or make extra passes over the weak strip, and total salt consumption climbs without making the road any safer. The fix is to verify spinner symmetry, vane condition, and conveyor feed rate against a documented pattern test, then lock in the settings that produce the balanced wedge shown above.
The True Cost of Spread Pattern Error
On the budget sheet, road salt looks like a simple line item. On the street, it behaves like a ledger that every shift writes into. When a spinner broadcasts unevenly – dense down the center of the lane, thin at the edges – a truck deposits more product than conditions demand in some strips and too little in others. To reach the same bare-pavement standard, operators widen the spread and run more passes. That is where material over-application starts quietly draining the account.
- Wasted material. Salt that lands in the wrong place still carries a price. Over-application on the crown burns product nobody needed, while under-application in the next lane forces a corrective pass that double-treats ground already salted.
- More reload trips. A load consumed faster than necessary sends the truck back to the yard sooner. Each extra return is a full cycle of travel, fill time, and re-entry onto the route.
- Higher labor and fuel costs. More trips mean more engine hours, more diesel, and more operator time. A driver idling in a loading line is paid whether or not salt is reaching asphalt.
Stack those effects across one truck, one fleet, and dozens of storm events, and salt budget waste compounds. This is how a third of a season’s salt allocation can disappear into inefficiency: not in one dramatic loss, but in thousands of small misplacements that each look harmless alone. The symptom is easy to see – rigs reload more often than they should – while the cause is less comfortable: the overrun is a calibration problem, not a demand problem. De-icing cost efficiency lives or dies on that distinction.
There is a second bill, too. Salt that misses its target lane still finds a home, often on truck hardware. If your fleet already battles road-salt corrosion eating into municipal truck frames, spread pattern error is quietly accelerating the damage you are paying to repair.
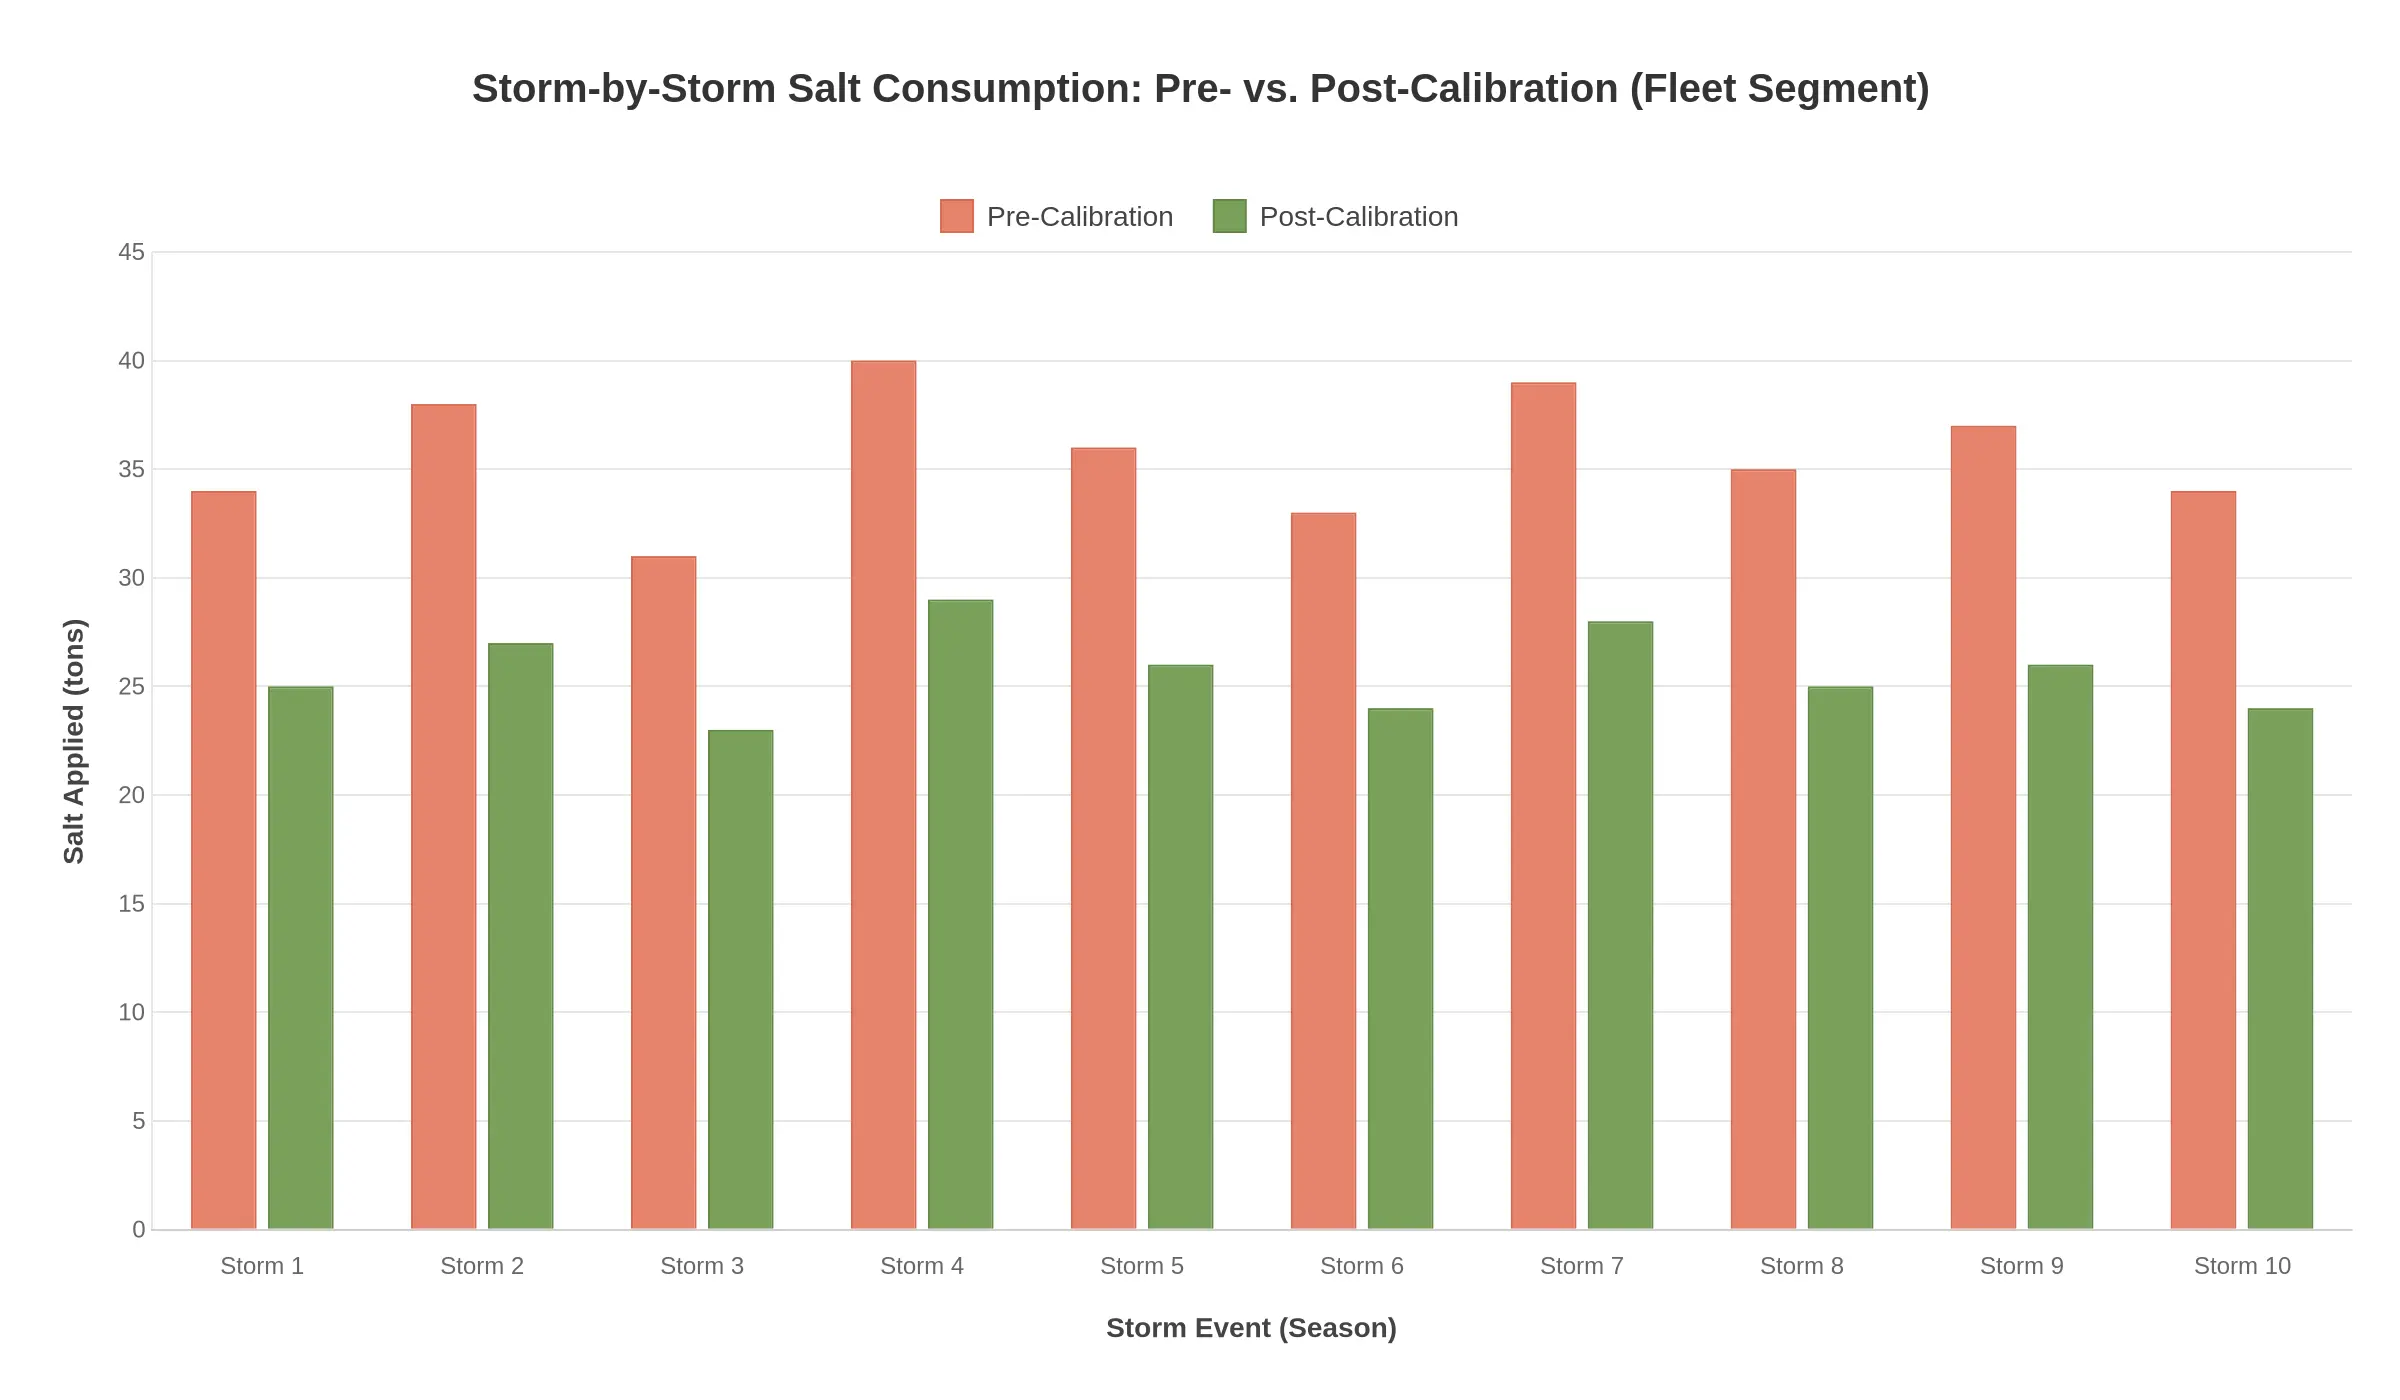
Takeaway for municipal fleet managers: Once calibration is locked in, every storm on the chart consumes less salt. The green bars sit 25-30% below the red ones, storm after storm, with no drift back toward the old numbers. That consistency is the point: the savings are structural, not lucky. Trim a quarter to a third off tons applied and a single fleet can hold onto tens of thousands of dollars of salt inventory in one winter while keeping roads clear. And as agencies adopt smarter efficient snow removal technologies, a calibrated spreader becomes the foundation the other gains are built on.
Fleets have several calibration methods to choose from, and each trades accuracy against time and equipment. The comparison below aligns each one with your spreader accuracy testing goals and calibration specifications.
| Calibration Method | What It Measures | Required Equipment | Accuracy Level | Typical Time Investment |
|---|---|---|---|---|
| Static Auger Output Testing | Material discharged per minute at fixed auger/conveyor settings | Platform scale, collection tarp or bins, stopwatch, adjustable controller | Moderate (baseline only) | 1-2 hours per truck |
| Dynamic In-Motion Calibration | Actual application rate at real driving speeds | Ground-truth scale, GPS or telemetry, test course, vehicle load cells | High | 2-4 hours plus road time |
| Spread Pattern Pan Testing | Lateral and longitudinal distribution uniformity | Grid of collection pans, measuring tools, calm test pad | High (pattern-specific) | 3-5 hours per configuration |
| Electronic/Automated Calibration | Continuous closed-loop rate verification and auto-adjustment | Onboard sensors, load cells, GPS, calibration software | Very High (real-time) | 30-60 minutes initial setup |
Which Method Fits Which Fleet
Small fleets (roughly one to ten trucks) are well served by static auger output testing, which needs minimal equipment and still gives a dependable baseline for spreader accuracy testing. Mid-sized fleets (ten to fifty units) get the most from dynamic in-motion calibration layered with periodic spread pattern pan testing, since that captures real-world variables such as speed, salt moisture, and hopper load. Large municipal fleets and DOT operations (fifty-plus trucks) get the most from electronic and automated calibration, where closed-loop sensors verify calibration specifications continuously and remove the manual drift that wastes salt. Adopting efficient snow removal technologies across all three tiers keeps every spreader accountable to the same performance standard.
Step-by-Step Salt Spreader Calibration Procedure
Work through these eight actions in order. Each one depends on the one before it, so skipping ahead usually ruins the accuracy of everything downstream.
-
Verify equipment and material type. Confirm the spreader model, the auger or conveyor configuration, and the exact de-icing material in the hopper (rock salt, treated salt, or sand mix). Density and gradation change flow volume directly, so log the vendor and mesh size before you touch a setting.
-
Establish baseline auger outputs. Run the auger for fixed intervals – 30, 60, and 90 seconds – then collect and weigh the material discharged in each run. A trustworthy calibration procedure builds on measured baselines, not manufacturer guesses or last season’s numbers.
-
Set gate openings per target application rate. Adjust gate height until the auger delivers the pounds per lane-mile you want, testing at low, medium, and high spreader settings. Record the exact gate position for each application rate so an operator can reproduce it on the road.
-
Measure spinner RPM and discharge. Use a tachometer to record spinner speed at each controller setting and confirm it matches the discharge width you expect. RPM that wanders is one of the fastest ways to lose product off the shoulder.
-
Run spread pattern pan tests. Lay a row of collection pans across the intended swath and drive past at your standard operating speed. Weigh each pan to map where material actually lands and whether the pattern is centered – see how the right spreader setup fits into broader efficient snow removal technologies for municipal plow trucks.
-
Adjust spinner and baffle settings. Tune spinner speed and baffle angle until the pan weights are even edge to edge and any overshoot past the curb is eliminated. Small baffle changes often recover the third of product a skewed pattern throws away.
-
Document results. Record gate position, auger output, spinner RPM, baffle angle, and pan weights for every truck and controller profile. That written record is what makes the next calibration fast and defensible.
-
Schedule re-verification intervals. Recalibrate at set intervals – typically at season start, after any controller repair, and mid-season – instead of waiting for a complaint about icy roads.
Why Documentation Protects Your Budget
A completed calibration log turns salt from a vague consumable into a tracked expense, which is exactly what the finance office wants to see when tonnage creeps up. With a documented application rate on each truck, a fleet manager can show performance, catch a spreader that is quietly over-applying, and justify a repair or a replacement with data instead of guesswork. Over a winter, disciplined records claw back a real share of a city’s salt budget and give public works directors the numbers to defend that spending to council.
A Phased Roadmap for Fleet-Wide Calibration Compliance
Calibration is a discipline, not a one-time repair. The most reliable path to lasting salt budget savings is to roll it out across the whole fleet in deliberate, measurable phases. A structured fleet calibration program turns scattered adjustments into a repeatable system that recovers public dollars winter after winter.
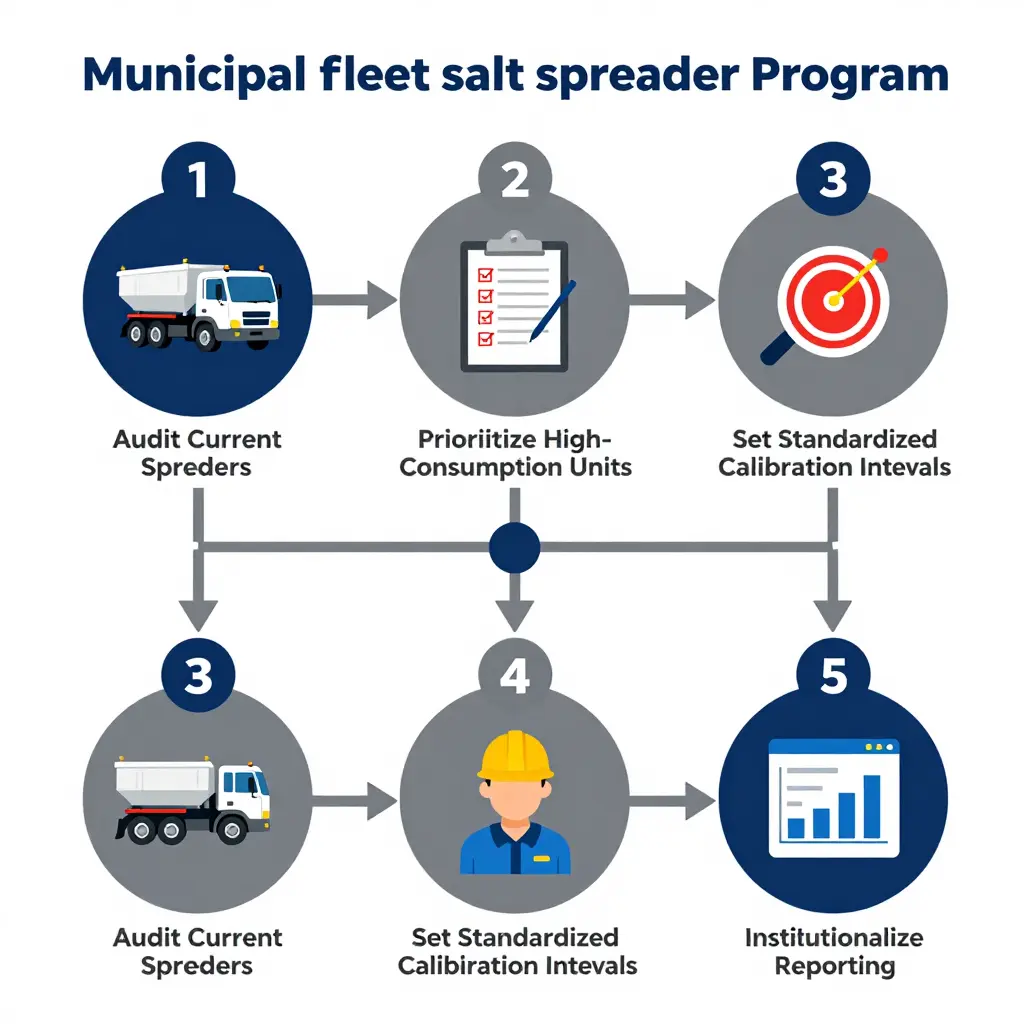
Phase 1 – Audit Current Spreaders. Document every spreader in service: controller model, auger type, gate opening, and last calibration date. Field-test each unit to measure actual pounds-per-lane-mile against the programmed rate. Any unit drifting more than 10 percent goes to the front of the line for correction or replacement, and where an audit turns up worn equipment you can source vetted municipal snow plow trucks for sale in Massachusetts to close the gap.
Phase 2 – Prioritize High-Consumption Units. Rank the fleet by salt used per route-mile and by route priority. High-volume arterial and interstate units pay back fastest when calibrated first, so do them before spending hours on low-mileage side-street trucks.
Phase 3 – Set Standardized Calibration Intervals. Replace guesswork with intervals tied to tonnage spread and engine run hours – verifying calibration every 150 tons of material applied, for example. Standardizing intervals across the fleet makes performance comparable and schedulable.
Phase 4 – Train Operators. A calibrated controller only performs as well as the operator understands it. Certify drivers on rate control, ground-speed sync, and daily pre-trip checks. Fleets that standardize on a single chassis get consistent interfaces, and operators who move between International municipal snow plow trucks get up to speed faster.
Phase 5 – Institutionalize Reporting. Lock in the gains with a recurring report that tracks application rate, material consumed, and dollars recovered per route – often the single largest lever for municipal salt budget savings.
| Phase | Core Action | Typical Window | Success Metric |
|---|---|---|---|
| 1 | Audit every spreader | Weeks 1-4 | 100% of units tested |
| 2 | Rank by consumption | Weeks 3-5 | Top 20 units prioritized |
| 3 | Standardize intervals | Month 2 | Intervals published fleet-wide |
| 4 | Train operators | Months 2-3 | 100% of drivers certified |
| 5 | Report and re-audit | Ongoing | Quarterly savings report delivered |
Run the five phases in order, and calibration stops being a seasonal scramble. It becomes routine work that pays for itself.
Salt Spreader Calibration: Frequently Asked Questions
Calibration is what separates a controlled application rate from expensive guesswork. Here are the questions municipal fleet teams ask most often, answered for operations that cannot afford to waste material or labor hours.
How often should a municipal salt spreader be calibrated?
Set your salt spreader calibration frequency by season and by change, not by the calendar alone. Industry practice is to recalibrate at the start of every winter and again after any repair to the auger, spinner, or hydraulic system. Trucks running more than 200 lane-miles per event should be re-verified mid-season, since damp or blended salt can shift material density and throw a previously accurate setting off by 15 percent or more.
Is calibration worth the labor cost it consumes?
Yes. A two-person calibration session usually costs only a few labor-hours, while an unverified spreader over-applying by 25 to 30 percent can waste tens of thousands of dollars in salt across a single winter. Add the avoided reload overtime and the reduced chloride exposure, and most fleets recover the labor cost after the first major storm. Calibration is one of the highest-return maintenance tasks in a snow budget.
How can a crew detect spread pattern error without expensive tools?
You can run a spread pattern verification with nothing more than a tarp, a scale, and a tape measure. Spread a weighed amount of material across a clean parking surface, compare the drop width against the manufacturer’s target, and check for left-right asymmetry. A spinner throwing heavy to one side is the visual signature of the error that quietly burns a third of a city salt budget.
How does calibration interact with salt corrosion and equipment longevity?
Tighter calibration reduces the total tonnage of chloride that reaches the hopper, frame, and wiring, directly slowing the corrosion process. Over-application leaves more brine on steel rails and harnesses, accelerating the rust that ends a chassis’ service life prematurely. For fleets already battling road-salt frame rust, pairing precise calibration with a scheduled rinse interval is one of the cheapest longevity measures available.
Quick-reference calibration schedule
| Spread Condition | Recommended Action | Typical Interval |
|---|---|---|
| Start of snow season | Full recalibration | Once per year |
| Auger, spinner, or hydraulic repair | Re-verify rate and pattern | After every repair |
| High-mileage route (>200 lane-miles/event) | Spread pattern verification | Mid-season |
| New salt type or blend | Recalibrate for density | On material change |
Conclusion: Spread Pattern Error Is a Solvable Line Item
Spread pattern error caused by poor salt spreader calibration is a controllable, recoverable cost, not an unavoidable weather expense. A city cannot decide how much snow the season delivers, but it can decide how evenly and accurately the salt goes down. When spreaders run out of spec, material lands where it is not needed and is missing where it is, quietly draining up to a third of the annual salt budget through overlap, over-application, and drift.
The levers are already within reach. Routine calibration keeps application rates aligned with real conditions. Spread pattern verification confirms that the salt reaches the lane width it was meant for. Electronic controls let an operator adjust rates from the cab as temperature and precipitation change. Fleet-wide standards make a well-calibrated truck the norm instead of the exception, so savings compound across the whole operation.
Each of these measures pays for itself. Recovered salt budget can be redirected toward equipment, staffing, or reserve, and the operational gains extend beyond a single winter. For a municipality ready to build a more disciplined snow program, the practical groundwork starts with reviewing the broader civic fleet guidance that frames these standards.
Treat calibration, verification, electronic control, and standardization as core operating practices, and a public works team can protect its city salt budget season after season, turning a recurring overspend into an efficiency win it can measure and defend.