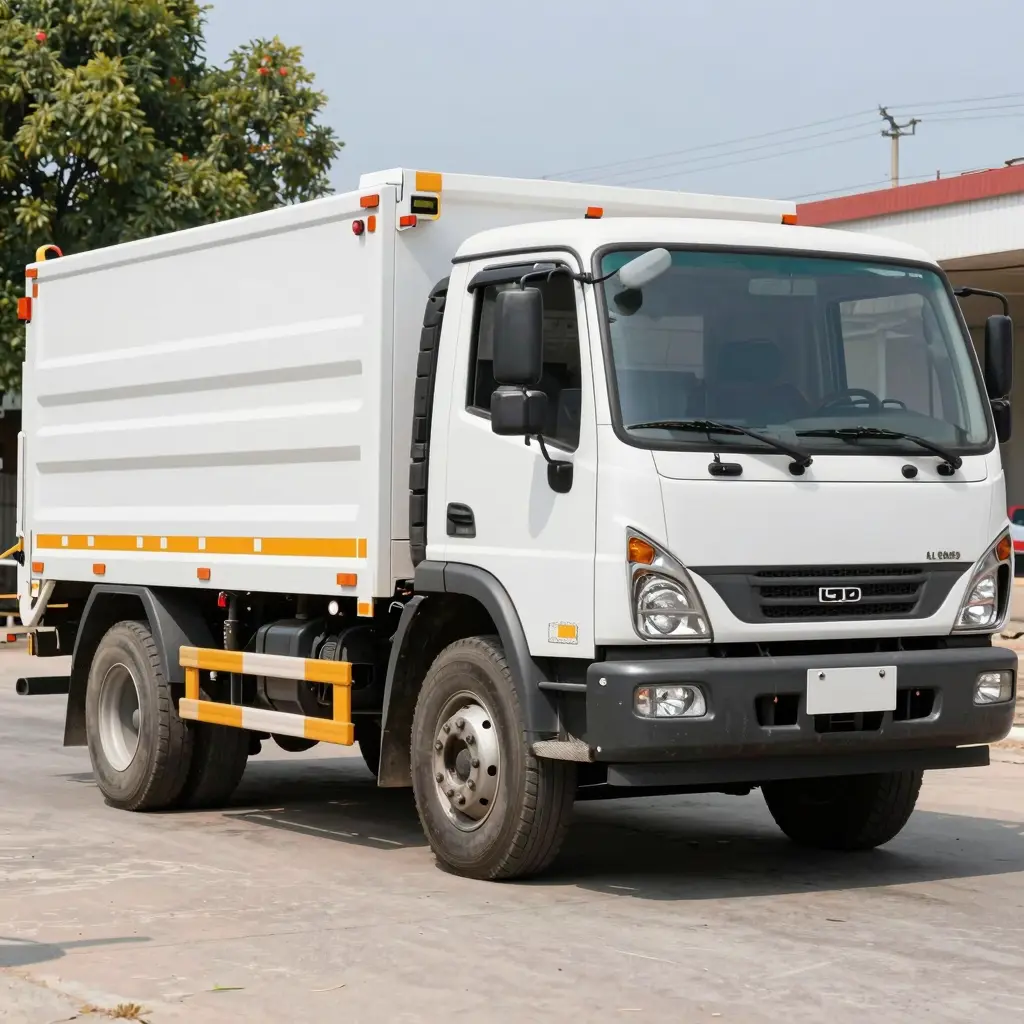

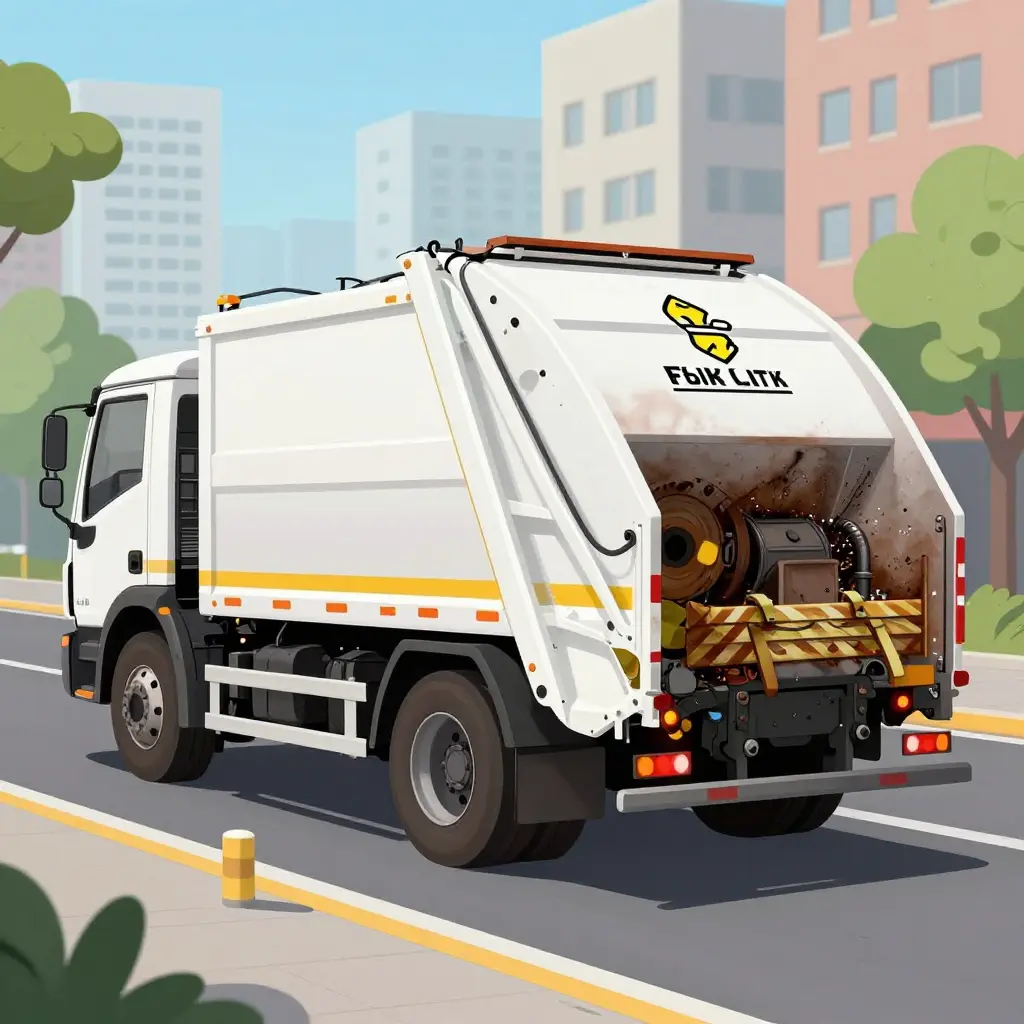
The Brake Duty Cycle Fleets Only See After Failures
A refuse truck is often specified around interstate braking assumptions, then spends its working life doing something else entirely. Procurement documents tend to inherit brake sizing and thermal expectations from highway linehaul duty: steady speeds, infrequent stops, long cooling intervals. A residential collection route offers none of that.
A single municipal garbage truck brake system may instead cycle through several hundred low-speed stops in one shift. The truck rarely reaches highway speed and almost never gets a sustained cooling period. Each stop is brief, but they keep coming, and the accumulation reshapes the refuse truck brake duty cycle in ways that static specification sheets never capture.
On these routes, municipal garbage truck brake wear tracks cycle count and thermal recovery time more than total mileage. Repeated low-speed apply-and-release cycles keep friction surfaces hot, leave little time to shed heat, and push components toward failure well before mileage-based service intervals predict. Most other refuse truck system failures announce themselves; brake degradation simply accumulates.
The duty cycle that governs real brake life is not the one written into procurement documents. It is the one recorded in the route bookkeeping of stop-start collection routes, measured in stops per shift rather than miles per year. Fleets tend to recognize it only after a failure forces them to look.
The Anatomy of a Single Stop-Start Cycle
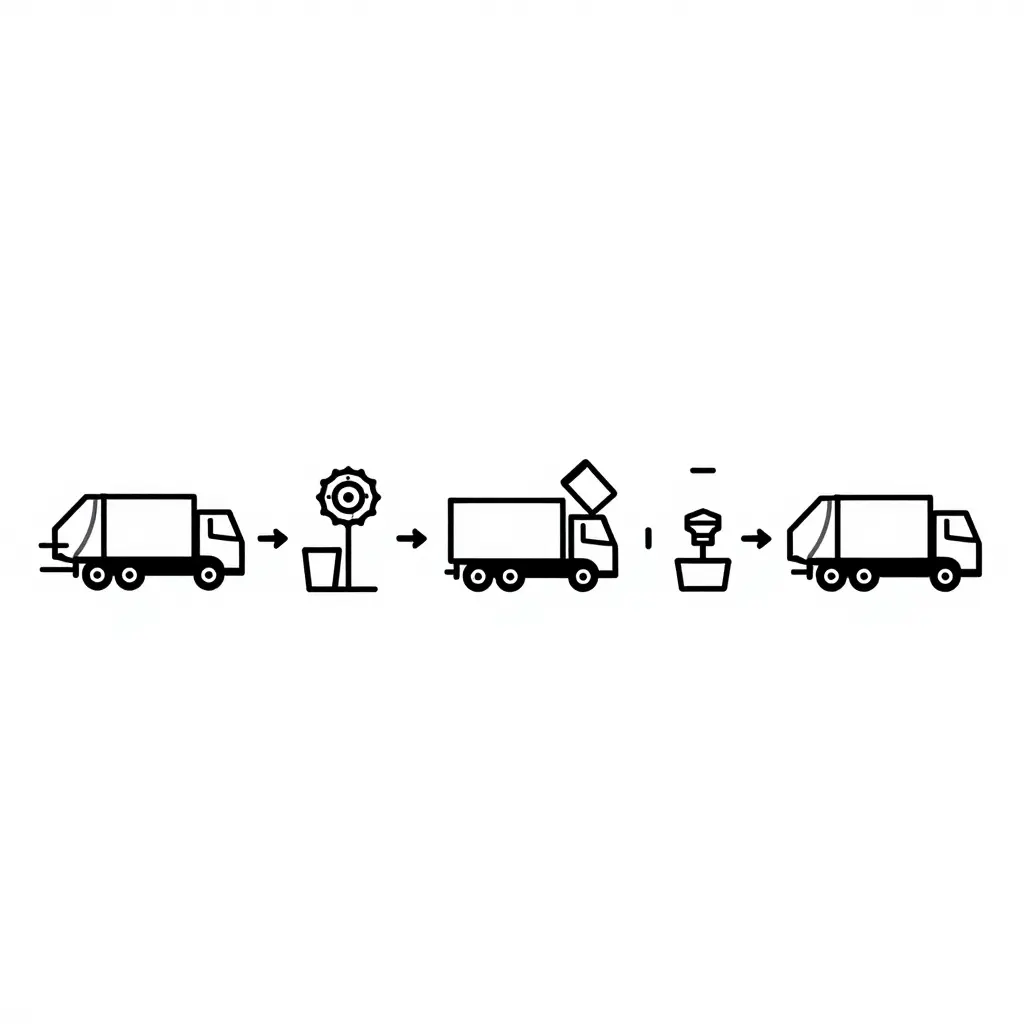
To diagnose why refuse-truck brakes fail early, you have to see the machine the way the brake system experiences it: not as a truck that drives a route, but as a repeating loop of five tightly spaced events. The diagram above isolates one complete cycle so you can trace it stage by stage.
Reading the cycle
- Vehicle in motion. The truck rolls toward the next collection point. On a dense residential block, this segment may last only a few seconds and cover less than 100 feet.
- Brake application. The driver brings the truck to a full stop at the curbside, often with a firm, short-duration application rather than a long, gradual deceleration.
- Dwell during loading. The truck sits stationary while the operator empties containers. During dwell the service brakes are typically held, which keeps heat and clamp force cycling through the foundation brakes and, on many chassis, the automatic slack adjusters.
- Brake release. The driver releases the brake and the truck is cleared to move again.
- Short-distance advance. The truck creeps forward to the very next stop, and the loop begins again.
Why the loop matters more than the miles
Conventional duty-cycle math rewards distance. A line-haul tractor that covers 100,000 miles a year spreads its brake events across a long, steady timeline. A collection truck may cover a fraction of that distance while executing thousands of apply-and-release events per shift. Each event imposes its own thermal and mechanical load on rotors, drums, pads, and shoes, and those loads accumulate even when the odometer barely moves.
That is the core reason fleet managers are often surprised at first brake service. The failure does not announce itself through mileage; it surfaces as heat-checked rotors, glazed friction material, and accelerated shoe wear that look far ahead of schedule relative to the odometer. Put a truck on a denser residential route or a longer dwell pattern and the cycle count climbs, along with the wear. Teams deciding whether to add, replace, or temporarily bridge capacity weigh these duty-cycle realities directly into their planning, as outlined in this guide to a municipal garbage truck rental plan.
What this means for service intervals
Treat the stop-start cycle, not the odometer, as the driver of the service interval. Each of those five stages is a data point and a wear event that a distance-based maintenance schedule simply cannot see.
Brake Wear Physics Under Refuse Collection Loads
Brake wear in refuse collection tracks energy absorbed, not distance traveled. A collection vehicle may cover far fewer miles than a line-haul tractor and still dissipate substantially more thermal energy through its friction pairs over the same service period.
Energy Dissipation in the Friction Pair
Every brake application converts kinetic energy into heat at the friction interface. The energy removed per stop follows the relationship E = ½mv², where m is vehicle mass and v is the pre-brake velocity. For refuse trucks, mass dominates the equation. A fully loaded collection vehicle operates near its gross vehicle weight (GVW) for most of the route. Low approach speeds reduce the velocity term, but extreme stop density — often several hundred applications per shift — restores the cumulative energy load. Each cycle deposits heat into the pad and rotor or the shoe and drum, and that heat must be rejected before the next application.
Brake Torque and Vehicle Weight
Retarding torque must counteract the momentum of the entire vehicle, so required torque scales directly with GVW and axle loading. On a loaded rear-loader or automated side-loader, the rear axle carries a disproportionate share of the compacted payload. That concentration raises torque demand at the rear friction pair and increases the work done per revolution. Sustained thermal buildup at these pairs is the primary driver of heavy-duty brake fade, in which friction coefficients decline as interface temperatures climb. On this duty cycle, fade is a recurring thermal condition, not an occasional annoyance.
Thermal Load and Cooling Intervals
Thermal load per stop depends on absorbed energy and the cooling interval between applications. Collection duty cycles offer short cooling windows. Heat accumulates faster than the drum or rotor can reject it, and repeated cycles drive temperatures into ranges that accelerate pad wear, rotor cracking, and drum distortion. This mirrors the broader pattern of thermal stress on refuse truck components, where heat-driven degradation shortens service life.
Why Refuse Truck Brake Durability Differs
A refuse truck brake system endures high-mass, high-frequency, low-velocity cycling. A line-haul truck experiences long cooling intervals between infrequent, high-speed stops. These are fundamentally different load profiles. Because of persistent mass loading and elevated axle weight, municipal garbage truck brake wear produces duty cycles that line-haul specifications never anticipate. Selecting replacement components against line-haul expectations understates the true thermal and torque demands of collection service.
Not every collection route punishes brakes equally. As the table below shows, braking demand swings dramatically across refuse and municipal duty cycles, and those swings are what separate a friction set that lasts two years from one that fails in six months. For a deeper look at how continuous-duty thermal stress wears other refuse truck systems, see our analysis of refuse truck systems under relentless duty-cycle stress.
| Duty Cycle | Approximate Stops per Shift | Typical Brake Applications per Hour | Estimated Friction Material Life | Dominant Wear Mechanism | Brake Thermal Exposure Rating |
|---|---|---|---|---|---|
| Residential stop-start collection | 800-1,200 | 100-150 | 1,500-2,500 hours (~25,000-40,000 mi) | Thermal fatigue cracking; abrasive scrubbing | High to Severe |
| Commercial container collection | 200-350 | 25-45 | 2,500-3,500 hours (~45,000-70,000 mi) | Mechanical shear; moderate thermal cycling | Moderate to High |
| Line-haul transfer | 40-80 | 5-10 | 4,000-5,500 hours (~90,000-130,000 mi) | Gradual oxidative film; light abrasion | Low to Moderate |
| Highway transit | 10-25 | 1-3 | 6,000-8,000 hours (~130,000-180,000 mi) | Slow oxidation; minimal friction loss | Low |
Stop-start collection routes concentrate brake applications and thermal load into a punishing cycle that accelerates municipal garbage truck brake wear, while highway transit and line-haul legs barely touch the friction material by comparison.
The Maintenance Data Blind Spots Fleets Miss
Fleet brake maintenance intervals in collection operations remain anchored almost entirely to the odometer, and that single assumption undermines the reliability of every downstream maintenance decision. A refuse truck on a residential route may log several hundred brake applications per shift while covering only 25 to 40 miles. Over a year, the calendar and the odometer suggest moderate service exposure, yet the foundation brakes have cycled hundreds of thousands of times. The record appears orderly; the equipment is being asked to do something the record never describes.
Odometer-based intervals are structurally blind to stop frequency. Two trucks with identical mileage can differ by an order of magnitude in brake duty cycle: one running highway transfer legs with occasional stops, the other crawling a dense collection grid with a stop, set, and release every few hundred feet. Because service triggers are defined in distance, both units receive the same inspection cadence despite radically different thermal and mechanical loads. Compounding this, most collection fleets do not log brake events per application. Without per-application event logging, there is no dataset capable of distinguishing a truck that stops 80 times a day from one that stops 800.
| Metric | Odometer-based interval | Cycle-based interval |
|---|---|---|
| Primary unit of measure | Miles traveled | Brake applications |
| Captures stop frequency | No | Yes |
| Reflects thermal load | Indirectly | Directly |
| Typical collection-route mismatch | Understates actual wear | Aligns with duty |
Deferred inspection triggers widen the gap further. When an inspection is scheduled by mileage and a low-distance collection truck is judged to have plenty of interval remaining, that assumption is inherited directly from a metric unrelated to wear. Wear onset therefore advances silently, and the lag between the physical start of degradation and the first reported failure is measured not in days but in pay periods. By the time a driver reports a soft pedal, a dragging caliper, or an air-consumption complaint, the wear process is well advanced while the maintenance record still reads as current. These mechanisms resemble other refuse truck reliability problems that only surface after a failure, because no intermediate data point ever flagged the escalation.
Fleets quantify brake life in miles while the equipment is governed by cycles. Until refuse truck brake duty cycle data — stop frequency, application counts, and duty severity — is captured and joined to the maintenance record, fleet brake maintenance intervals will continue to describe the wrong variable. The consequence is not simply premature replacement or extended service; it is the systematic misreporting of when brake work was actually required, which distorts lifecycle cost, parts forecasting, and warranty analysis across the entire collection fleet.
Chart Design Specification
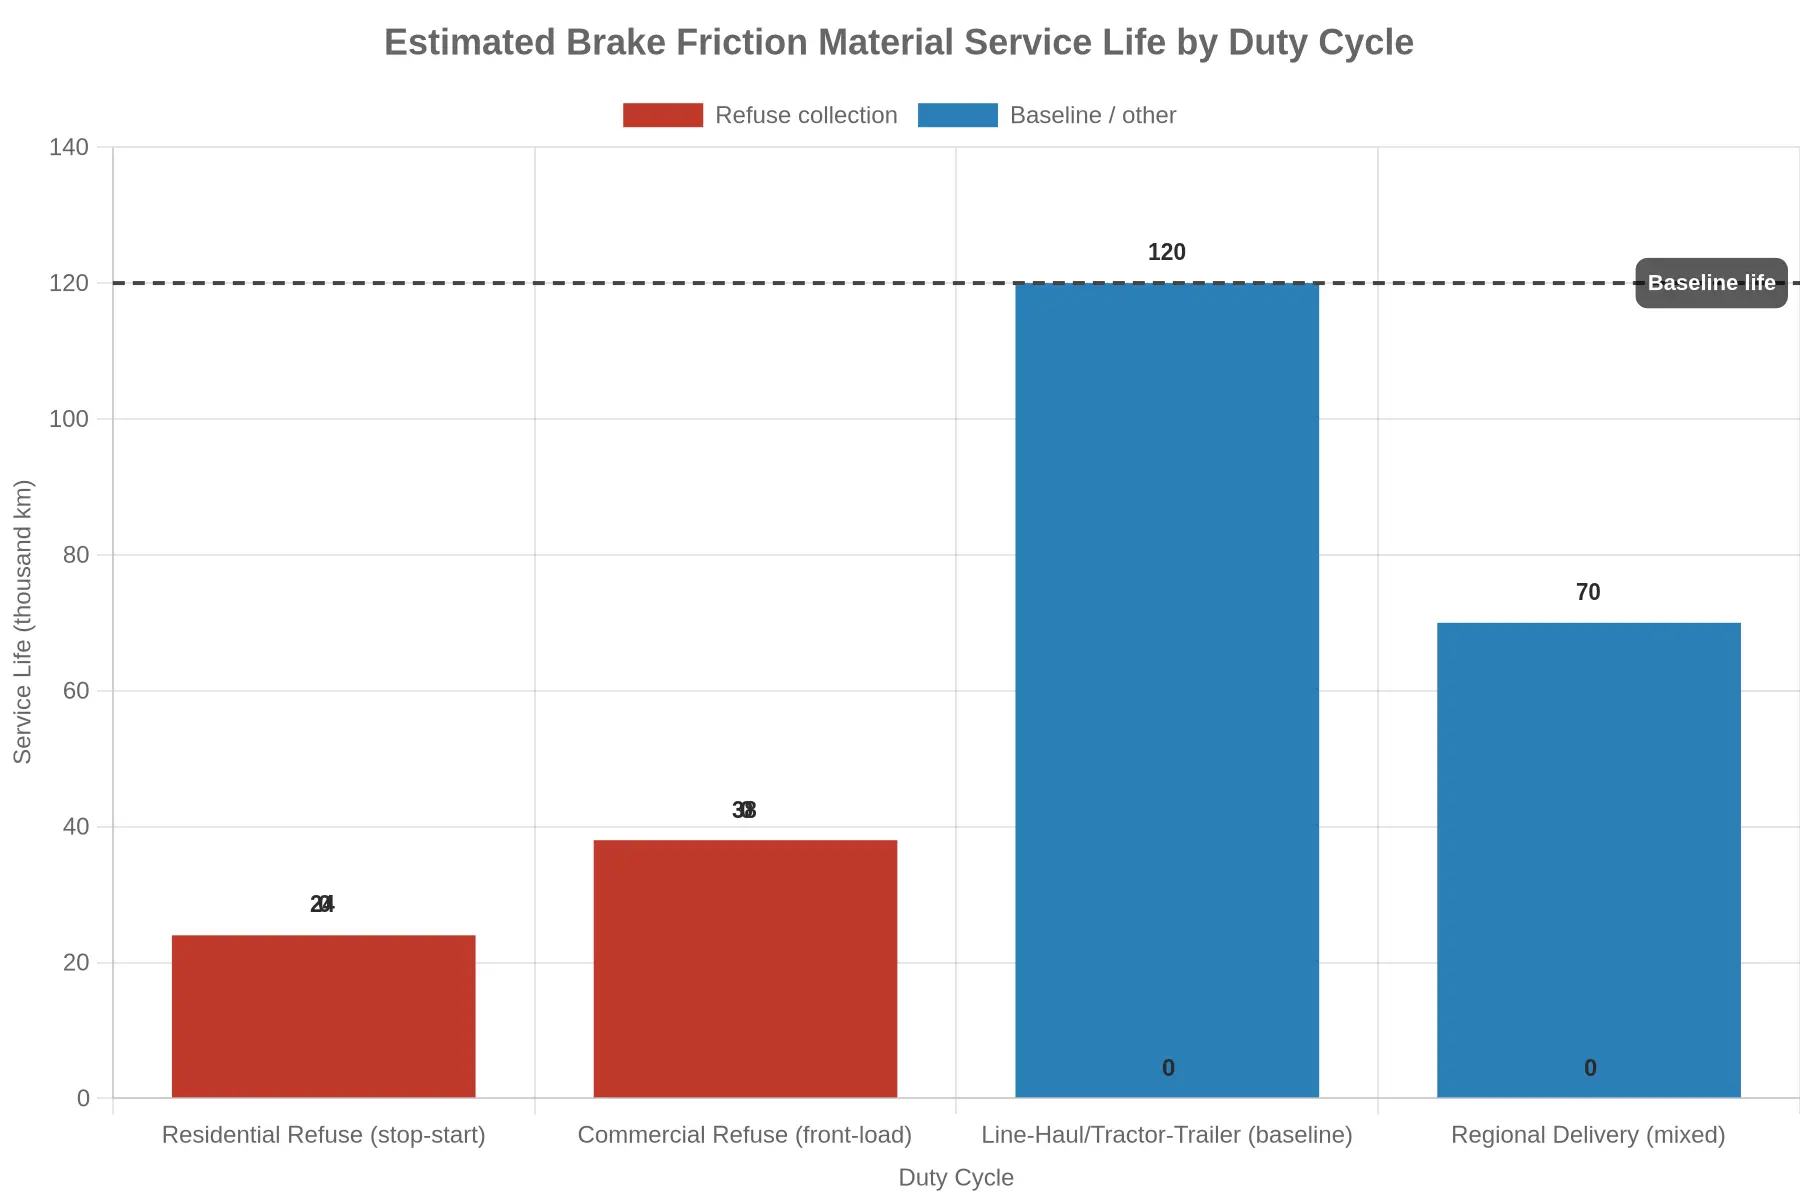
Title: Estimated Brake Friction Material Service Life by Duty Cycle
Chart type: Grouped / stacked bar chart (single series rendered across categories)
Axes:
- Y-axis label: Service Life (thousand km)
- X-axis label: Duty Cycle
Legend:
Refuse collection(red bars)Baseline / other(blue bars)
Data points (categories and values):
| Duty Cycle Category | Series | Service Life (thousand km) |
|---|---|---|
| Residential Refuse (stop-start) | Refuse collection | 24 |
| Commercial Refuse (front-load) | Refuse collection | 38 |
| Line-Haul / Tractor-Trailer (baseline) | Baseline / other | 120 |
| Regional Delivery (mixed) | Baseline / other | 70 |
Reference line: Horizontal dashed line at 120 thousand km, labeled Baseline life.
Embeddable chart:
Caption:
Residential stop-start collection routes cut estimated brake friction material life to roughly 24 thousand km, about a fifth of the 120 thousand km line-haul baseline, which is exactly why municipal garbage truck brake wear is so aggressive on stop-start collection routes.
When brake life collapses like this, the underlying thermal and contamination stress is often shared with other hydraulic components under the same duty cycle, as explored in our analysis of refuse truck compaction hydraulic failures.
Thermal Loading and Brake Fade on Collection Routes
Refuse collection is one of the most thermally demanding duty cycles in municipal service. A rear-loader or automated side-loader typically makes 600 to 1,200 service brake applications per shift, each at low road speed with only short distances between stops. The kinetic energy of every stop leaves the friction pair as heat, and the truck never sustains the road speed that would drive forced-convection cooling, so heat builds faster than it can be rejected to ambient air. The refuse truck brake system settles at an elevated temperature instead of returning to a cool baseline between stops — very different from line-haul trucking, where long gaps between events give the brakes time to cool. The same thermal dynamics also stress adjacent subsystems, as covered in our analysis of summer heat and refuse truck component stress.
Drum Versus Disc Thermal Behavior
Thermal response depends heavily on architecture. Drum brakes concentrate mass around the friction surface but enclose it, which limits convective exchange and lets heat soak into the drum and the surrounding wheel-end components. As a drum heats it expands radially; when that expansion outpaces the shoes’ ability to follow, effective contact area drops and the driver needs more pedal force for the same retardation. Disc brakes expose the rotor to airflow and shed heat faster, but repeated cycles can still cause thermal cracking and uneven pad deposition across the rotor face. In both designs the enclosure and mass distribution set how quickly heat is stored or released, which governs how the refuse truck brake system performs over a long, uninterrupted collection route.
Fade Onset and Lining Degradation
This is where heavy-duty brake fade begins. As lining temperature climbs past the resin’s thermal stability threshold, the binder breaks down and outgasses, leaving a thin gas film at the friction interface that lowers the coefficient of friction. Fade is not a single event; once temperatures stay high enough to alter the lining’s chemistry, retardation drops progressively and largely irreversibly. Duty cycle intensity — stops per mile, average brake energy per stop, total mass hauled — drives the rate of lining degradation, because oxidative wear and thermal cracking both scale with cumulative heat exposure. Drum distortion and rotor warping follow the same logic: uneven heating and cooling produce permanent dimensional change, which brings vibration and more inconsistency in braking.
The Temperature-Cooling-Fade Relationship
The variable that links these effects is the relationship between peak brake temperature, the available cooling interval, and residual fade risk. A route with long transfer legs between neighborhoods lets the wheel end shed stored heat and reset its thermal margin before the next dense cluster of stops. A route that is dense and continuous has almost no cooling interval, and brake temperature ratchets upward until fade risk is continuous rather than intermittent.
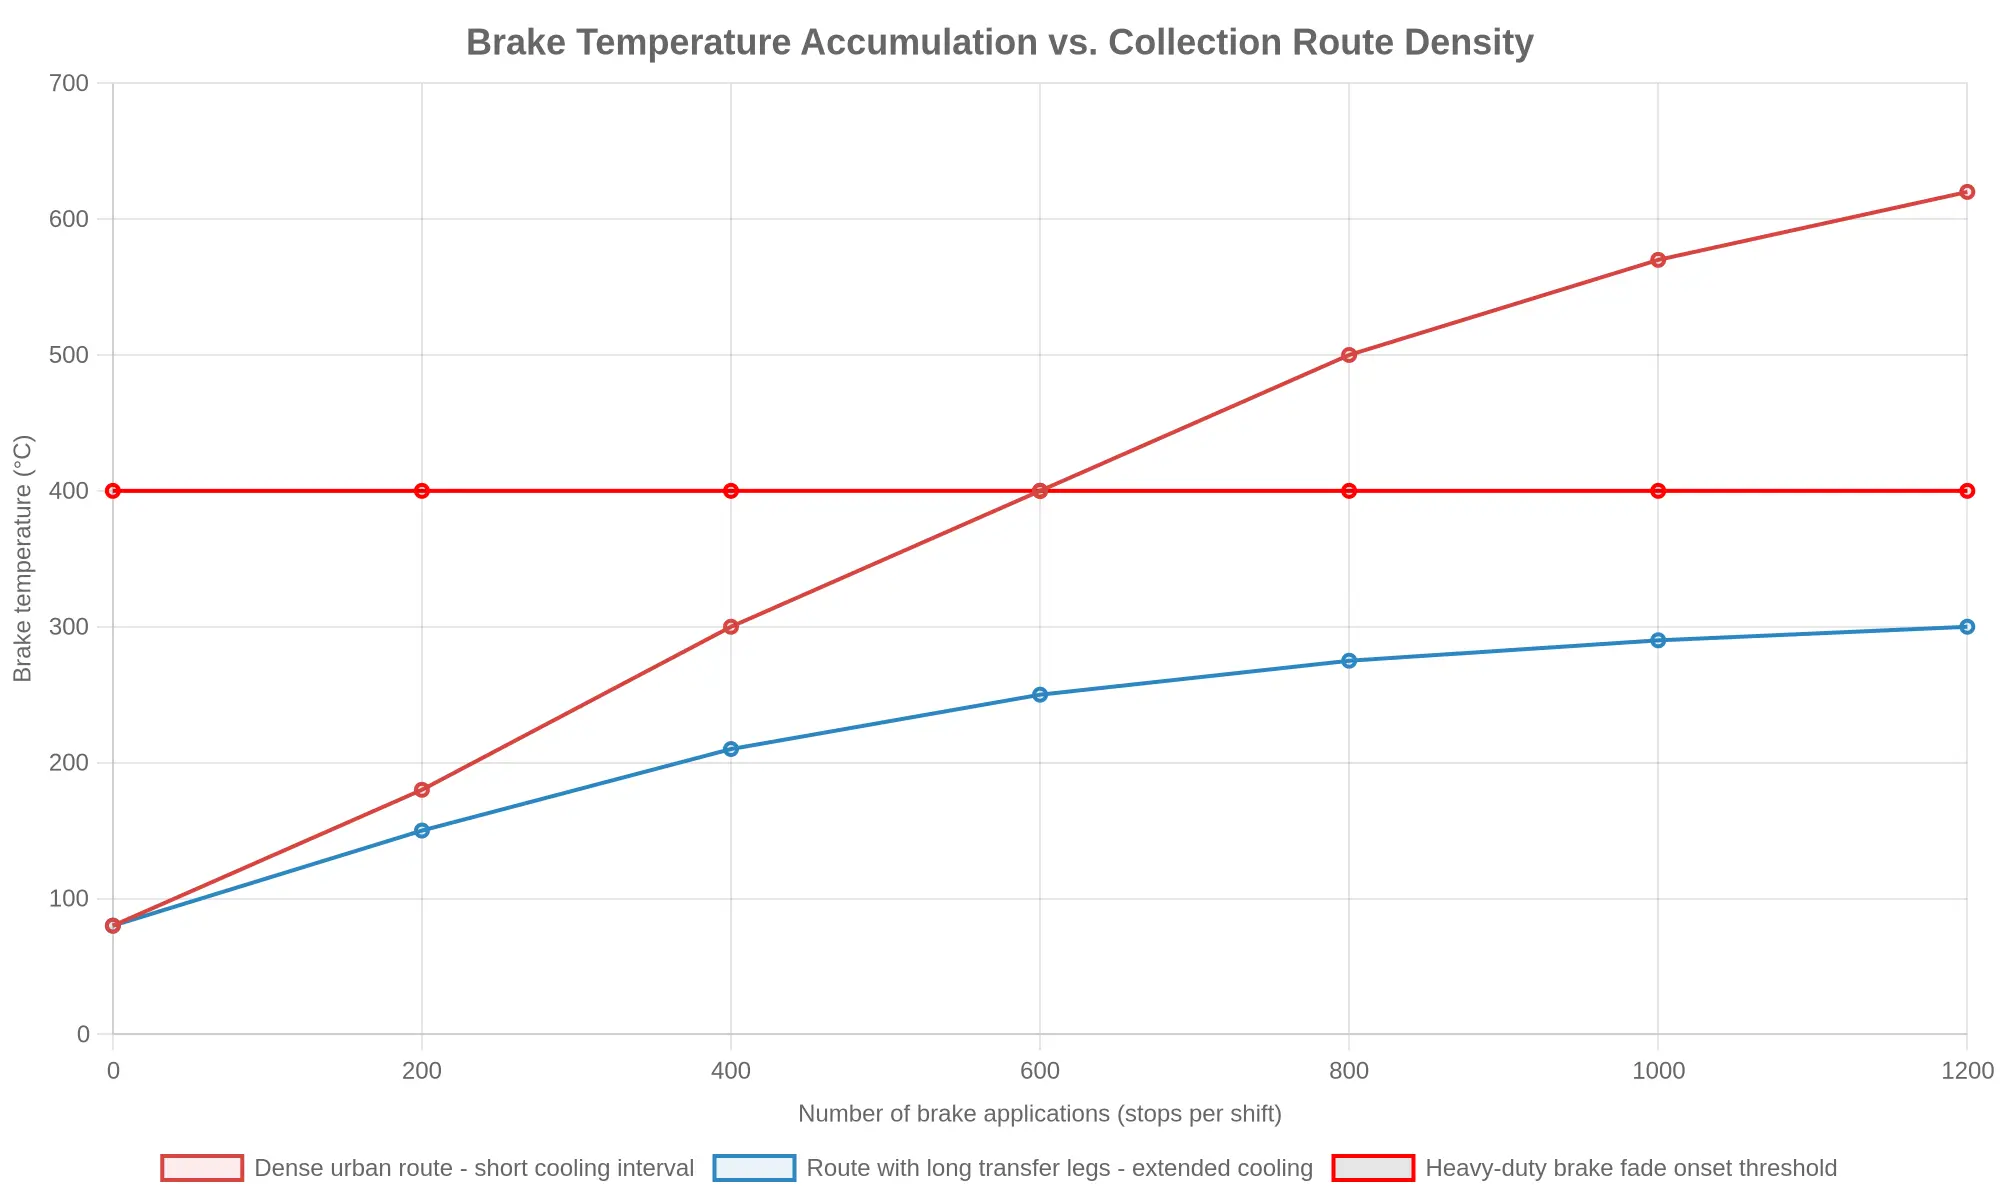
Fleet engineers should treat cooling interval as a design parameter of the route itself, not just a property of the brake hardware, and specify lining compounds and friction architecture accordingly. That balance is the practical difference between a brake system that degrades predictably and one that fails without warning.
Brake System Architecture for Refuse Applications
Municipal refuse collection imposes one of the hardest foundation-brake duty cycles in the heavy-truck sector. A typical rear-loader or automated side-loader completes 800 to 1,200 stop events per shift at road speeds below 25 mph (40 km/h), with applications separated by intervals too short to let the friction pairs cool fully. That high-frequency, low-speed profile drives municipal garbage truck brake wear and shapes brake architecture more than gross vehicle weight does.
The dominant configuration is still the air brake system: a dual-circuit compressed-air foundation charged by an engine-driven compressor and controlled through treadle and relay valves. Air actuation is preferred for its fail-safe spring-brake parking function and for meeting the high air demand of the compaction, tipper, and tailgate circuits on the same chassis. In the S-cam drum brake that usually converts air pressure into retardation, stress concentrates in the linings, the cast drum, and the S-cam shaft and bushings. Repeated low-speed stops raise friction temperatures, which promotes drum scoring, heat checking, and lining glaze; the S-cam’s mechanical advantage multiplies torque loads through the spider and anchor pins.
Air disc brakes are increasingly specified, first on steer axles and now on drive and tag positions of newer chassis. Clamping a caliper against a flat rotor instead of expanding shoes inside a drum resists fade, reduces thermal deflection, and shortens stopping distance. On stop-start collection duty they hold friction performance more consistently across heat cycles and limit lining taper, but they shift wear to rotor thickness loss, caliper slide-pin lubrication, and pad-retention hardware, so inspection intervals tighten.
Two control subsystems govern how these friction pairs age. Automatic slack adjusters (ASAs) keep pushrod stroke correct as linings wear — important when hundreds of daily applications push wear toward the adjustment limit and a seized ASA can leave a brake out of adjustment. Antilock braking systems (ABS) modulate pressure at each wheel to preserve steering and stability during hard stops, and frequent low-speed cycles exercise ABS solenoids and wheel-speed sensors heavily on refuse routes.
The fastest-moving development is regenerative and energy-recovery braking on hybrid and battery-electric refuse trucks. These drivetrains use motor-generator retardation to recapture energy during deceleration, which cuts friction-brake use and extends lining and drum life. Blending is the engineering challenge: at the very low speeds of collection duty, friction brakes have to re-engage smoothly, and stopping energy that cannot be recuperated still loads the conventional foundation. These trucks also share thermal management with their hydraulic work circuits, so brake and body-system heat loads interact; the same thermal-stress mechanisms behind seal failure in compaction hydraulics apply to shared cooling and fluid paths.
| Architecture | Behavior in Stop-Start Duty | Highest-Stress Components |
|---|---|---|
| Air / S-cam drum | Consistent torque; heat retained between stops | Linings, drum, S-cam bushings |
| Air disc | Superior fade resistance; faster heat recovery | Rotor, caliper slide pins, pads |
| Automatic slack adjuster | Maintains stroke; seizure risk under high cycle counts | Worm gear, clevis, pushrod |
| ABS | Modulates pressure; frequent low-speed cycling | Solenoid valves, wheel-speed sensors |
| Regenerative / energy recovery | Cuts friction wear; demands low-speed blend control | Blending controls, shared cooling circuits |
How to Read This Cycle
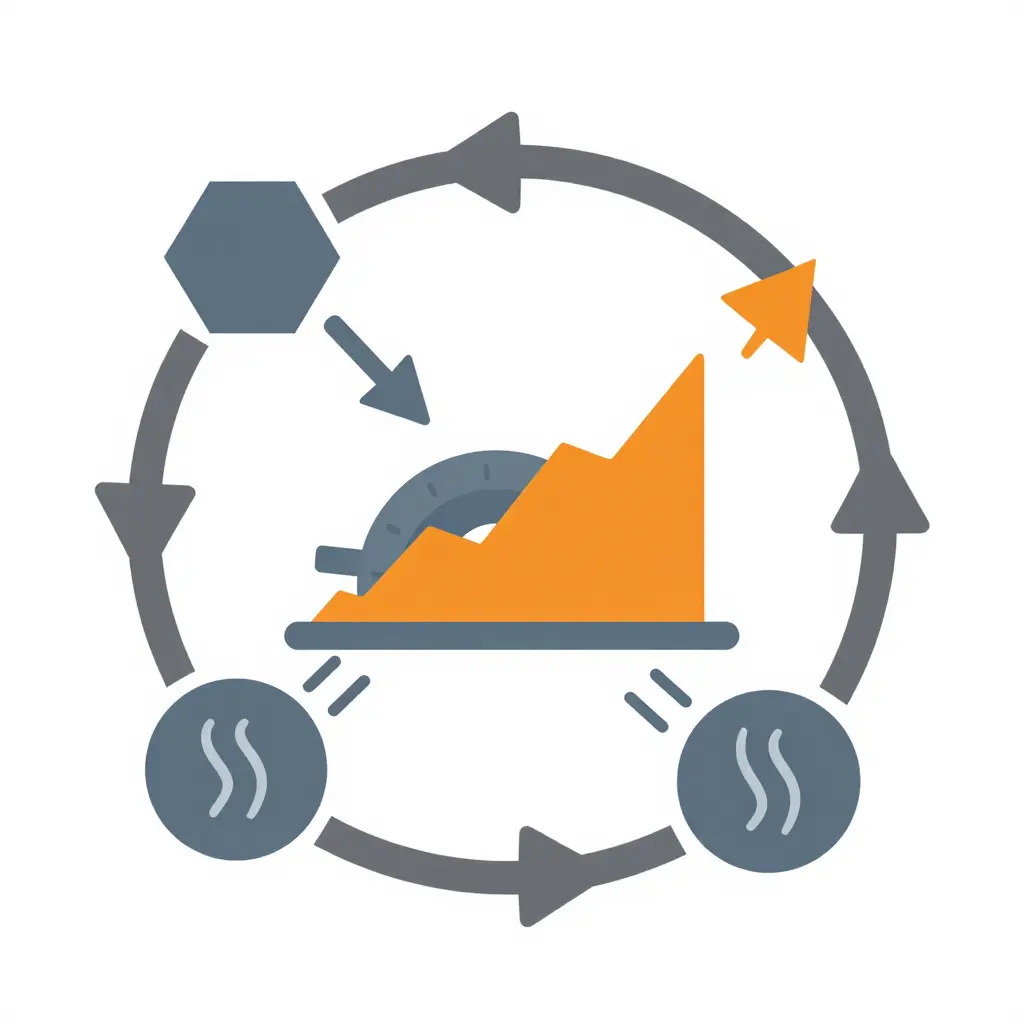
The diagram maps a loop that repeats hundreds of times per shift on a stop-start collection route. Energy enters each time the driver brakes, converting the truck’s momentum into heat inside the drum or disc. That heat does not leave as fast as it arrives.
Braking energy input is the hexagon on the left: every hard stop and slow creep over a fully loaded truck feeds energy in. Heat accumulation is the rounded rectangle, the mass that soaks up thermal energy faster than airflow and metal can shed it. The cycle then splits into two partial cooling paths. Dwell cooling happens in the brief seconds while the truck is stopped and the operator works the lift or packs the load. Travel cooling is the airflow gained while rolling between stops.
Dwell and travel windows are short, so they recover only a fraction of the stored heat before the next braking event adds more. Each pass leaves a little more heat behind, which is why the rising stepped line points to net thermal escalation across a shift. That accumulating baseline pushes friction material past its fade threshold, and it sits alongside other heat-driven failures, such as the seal problems covered in our guide to refuse truck compaction hydraulics in summer heat.
The loop shows why short cooling windows, not stop count alone, drive heavy-duty brake fade on collection routes.
Duty Cycle Telemetry and Brake Event Logging
Quantifying true brake duty cycle starts with instrumentation that captures events, not distance. Brake event counters wire into the service brake circuit and log every application, and air pressure logging records reservoir pressure decay, compressor charge cycles, and full-stroke service applications per shift. On air-braked refuse chassis, those signals separate a gentle rolling stop from a hard, heat-generating full-pressure stop, and they expose the rapid-fire cycles that define stop-start collection routes. A single telematics gateway on the J1939 CAN-bus can harvest wheel-speed, brake switch status, retarder usage, and ABS event flags at once, giving fleet engineers a high-resolution record of how each vehicle is actually driven.
Wheel-end temperature sensing closes the loop between application frequency and thermal load. Infrared or embedded hub sensors track drum and rotor temperature rise between stops, showing when consecutive braking events overwhelm cooling airflow and drive friction material past its design window. GPS stop-density mapping adds dwell points, acceleration signatures, and deceleration gradients across a route; profiling by collection area separates curb-line residential pickups from commercial bin pulls and transfer hauls. The resulting datasets quantify brake applications per mile by route type, as the chart below shows.
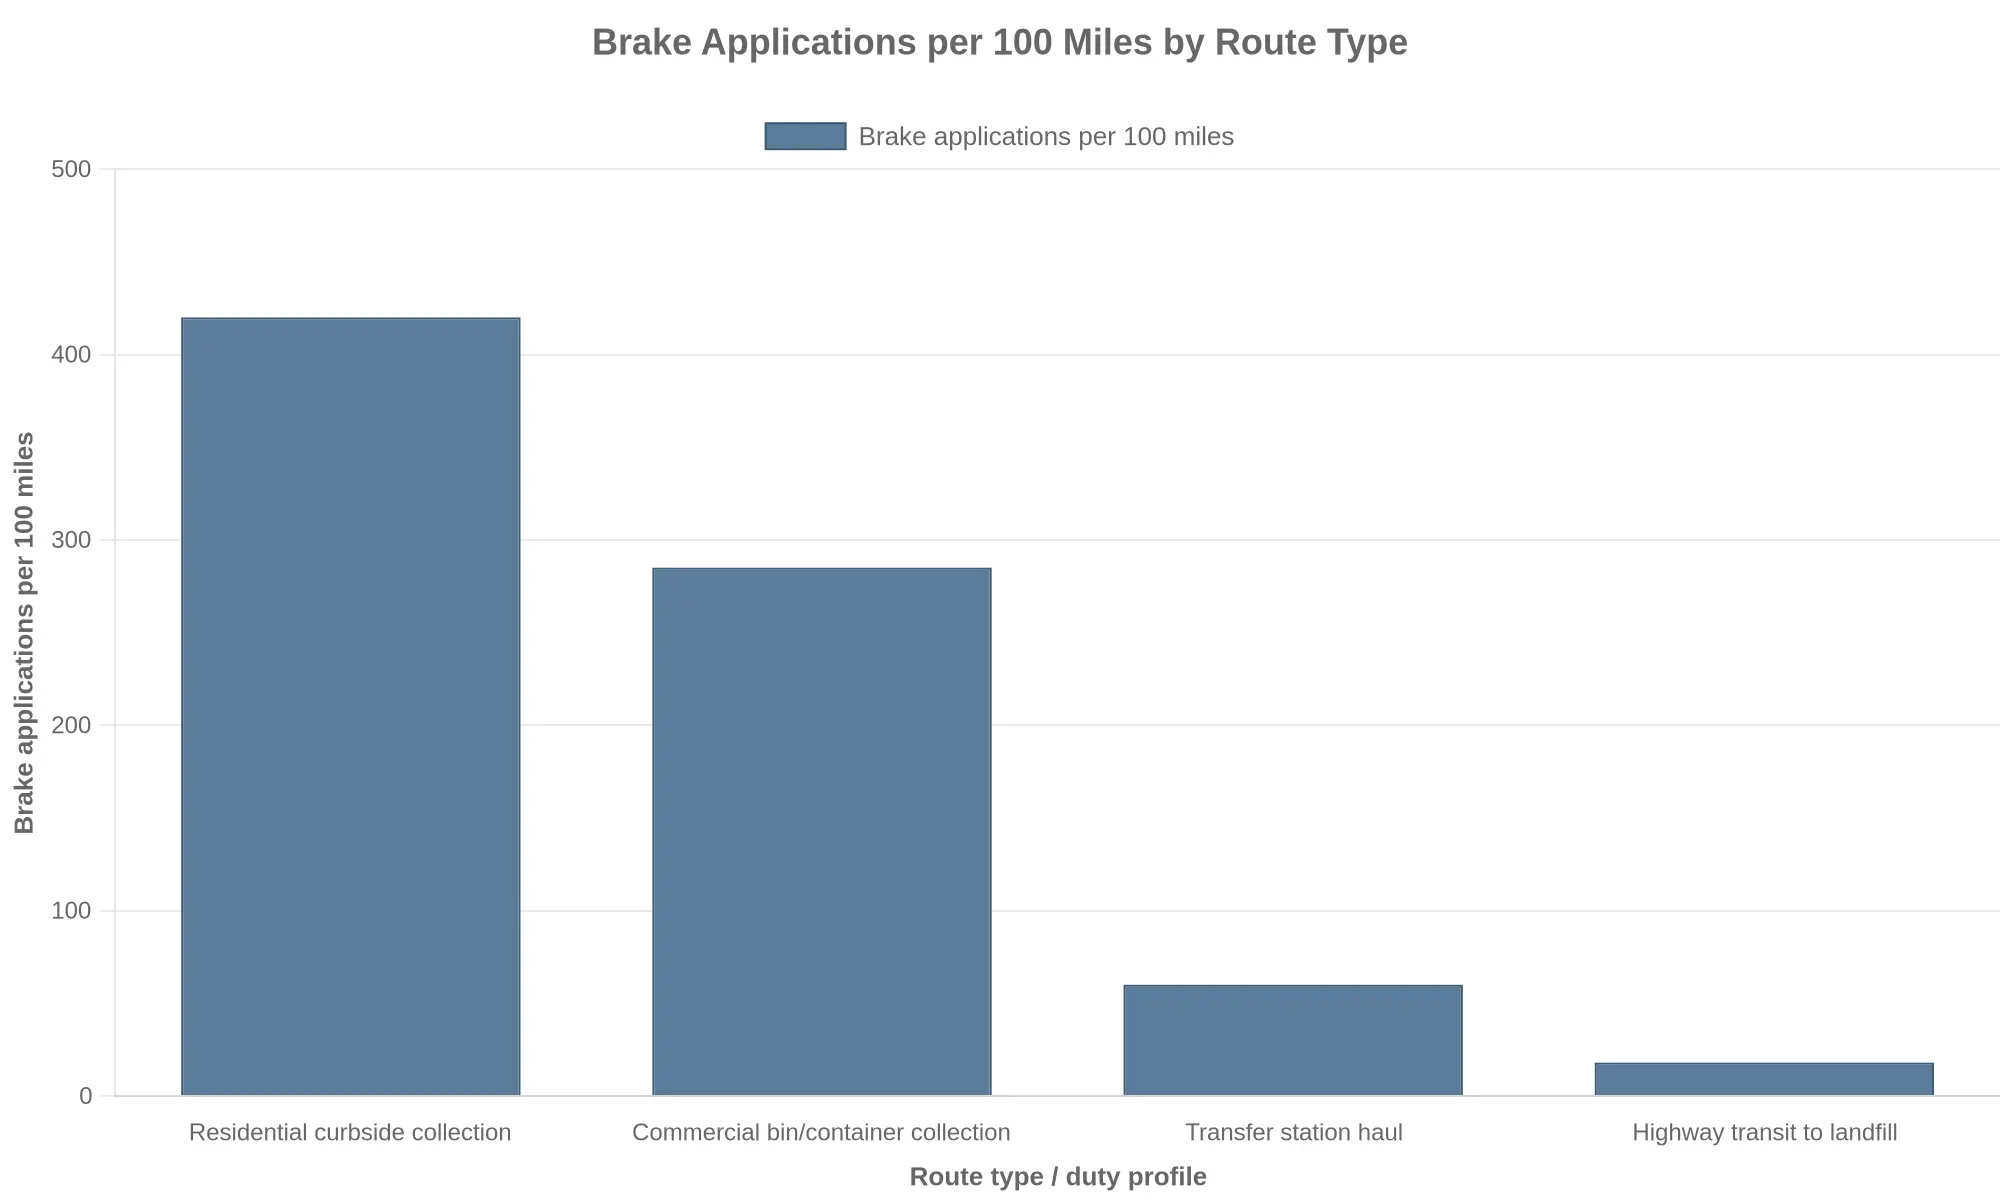
These streams move brake planning from mileage-based to cycle-based logic. Mileage assumes every truck accumulates wear at the same rate, but a residential collection unit logging 420 applications per 100 miles can see an order of magnitude more friction cycles than a transfer hauler covering the same distance. Cycle-based planning ties fleet brake maintenance intervals to measured application counts, thermal exposure, and air-system cycles, so inspections, lining replacement, and slack adjuster service follow actual wear drivers instead of odometer thresholds. The same evidence applies to sourcing: specifying a hooklift or automated side-loader for a collection area should follow the anticipated cycle rate, stop density, and recuperative brake demand, not just gross vehicle weight. Fleets working through that decision can review guidance on hooklift collection vehicle selection to align body configuration with real duty-cycle telemetry.
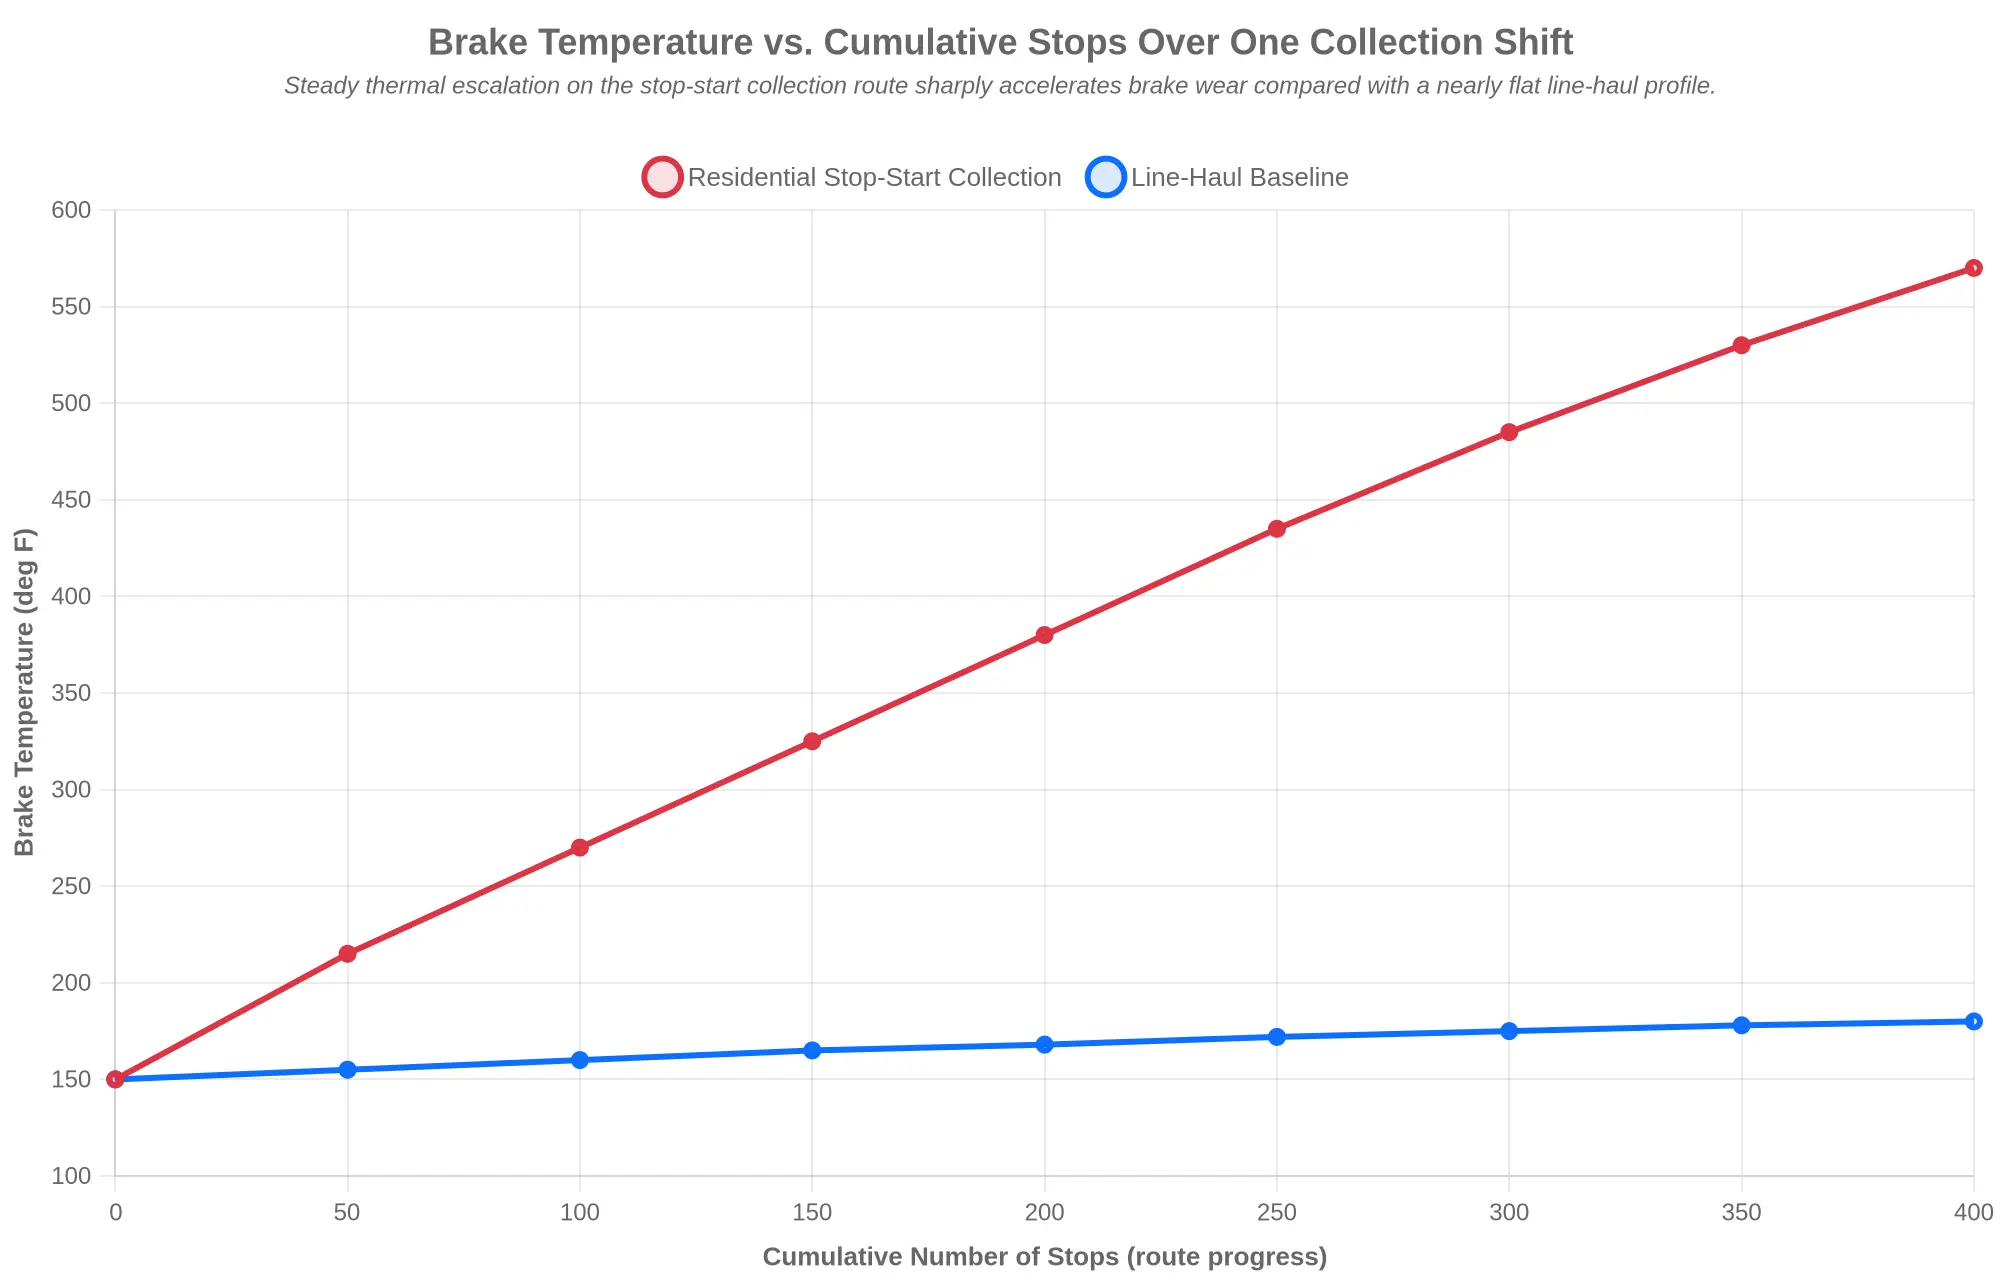
Chart Specification (Embeddable)
Chart Type: Line chart
Title: Brake Temperature vs. Cumulative Stops Over One Collection Shift
X-axis label: Cumulative Number of Stops (route progress)
Y-axis label: Brake Temperature (deg F)
Legend: Residential Stop-Start Collection | Line-Haul Baseline
| X: Cumulative Stops | Residential Stop-Start Collection (deg F) | Line-Haul Baseline (deg F) |
|---|---|---|
| 0 | 150 | 150 |
| 50 | 215 | 155 |
| 100 | 270 | 160 |
| 150 | 325 | 165 |
| 200 | 380 | 168 |
| 250 | 435 | 172 |
| 300 | 485 | 175 |
| 350 | 530 | 178 |
| 400 | 570 | 180 |
Series 1 – Residential Stop-Start Collection: 150, 215, 270, 325, 380, 435, 485, 530, 570 (border #DC3545)
Series 2 – Line-Haul Baseline: 150, 155, 160, 165, 168, 172, 175, 178, 180 (border #0D6EFD)
Caption: Steady thermal escalation on the stop-start collection route sharply accelerates municipal garbage truck brake wear compared with a nearly flat line-haul profile.
Braking Strategy, Specification, and Maintenance Planning
Managing brake wear on refuse trucks starts with acknowledging that collection duty cycles differ fundamentally from highway operation. A rear-loader or automated side-loader may make several hundred stops per shift, each converting kinetic energy into heat at the foundation brakes. Instead of defaulting to calendar or odometer intervals, fleet managers should derive service intervals from measured brake applications per route, average axle loading, and gross vehicle weight including the compactor body. Baselining stop density and payload per route lets maintenance planning anticipate lining consumption instead of reacting to it.
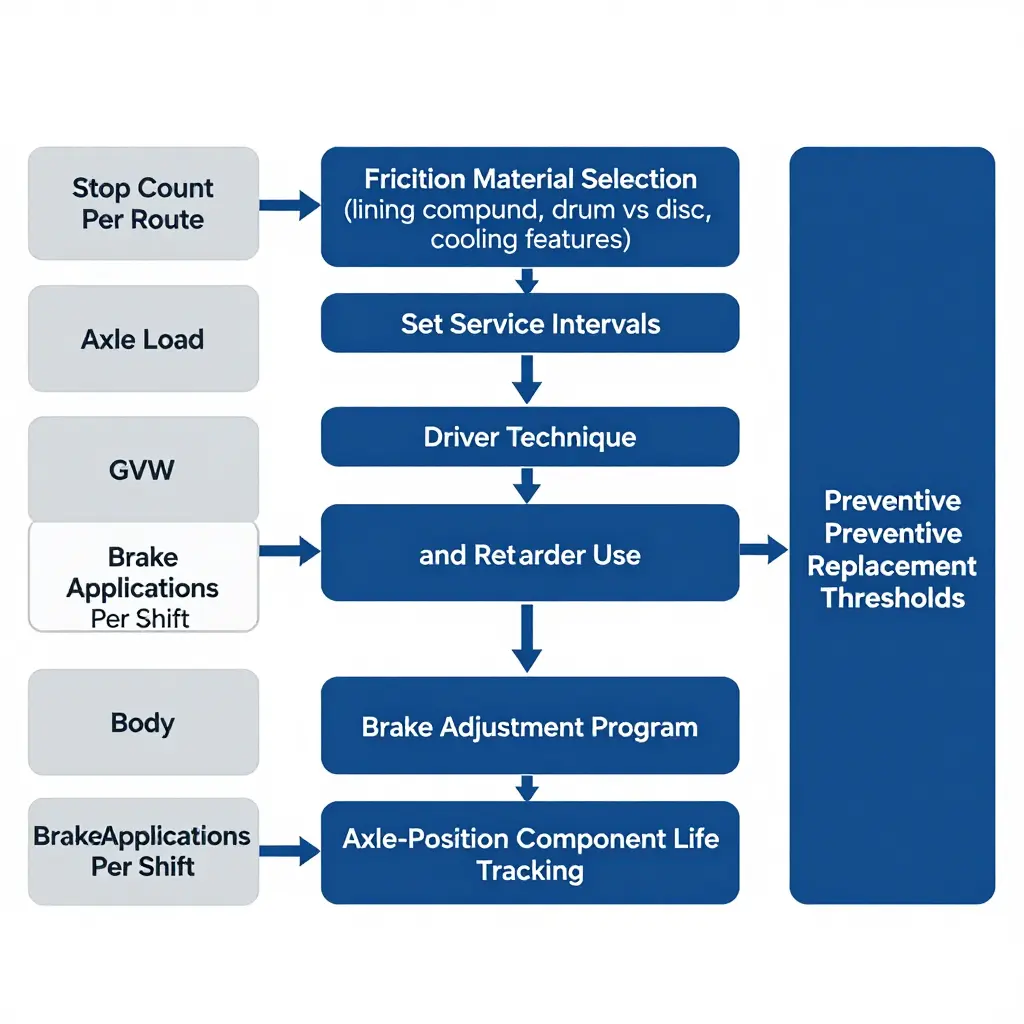
Specification choices matter just as much. Lining compound selection should match the thermal profile of collection work: high-friction, fade-resistant compounds that tolerate repeated heat cycling without glazing. Drum versus disc matters too. Larger drums increase heat capacity and cooling; air-disc systems deliver more consistent torque and faster lining replacement. Where routes involve steep grades or heavy loads, ventilated rotors, finned drums, and airflow-directed backing plates aid heat rejection. Specifying these features at procurement, or as a documented requirement when structuring a municipal garbage truck rental plan, keeps undersized systems out of service.
Driver technique is one of the most controllable variables. Progressive braking, throttle discipline, and early use of engine brakes or retarders cut the energy the service brakes absorb. Retarders are especially effective on descents and approach segments, including the grades common on transfer and disposal runs, keeping foundation brake temperatures in a range that protects lining life. Fleets running combined collection-and-disposal routes, such as those supported by municipal solid waste landfill truck operations, get the most from retarder specification and driver coaching.
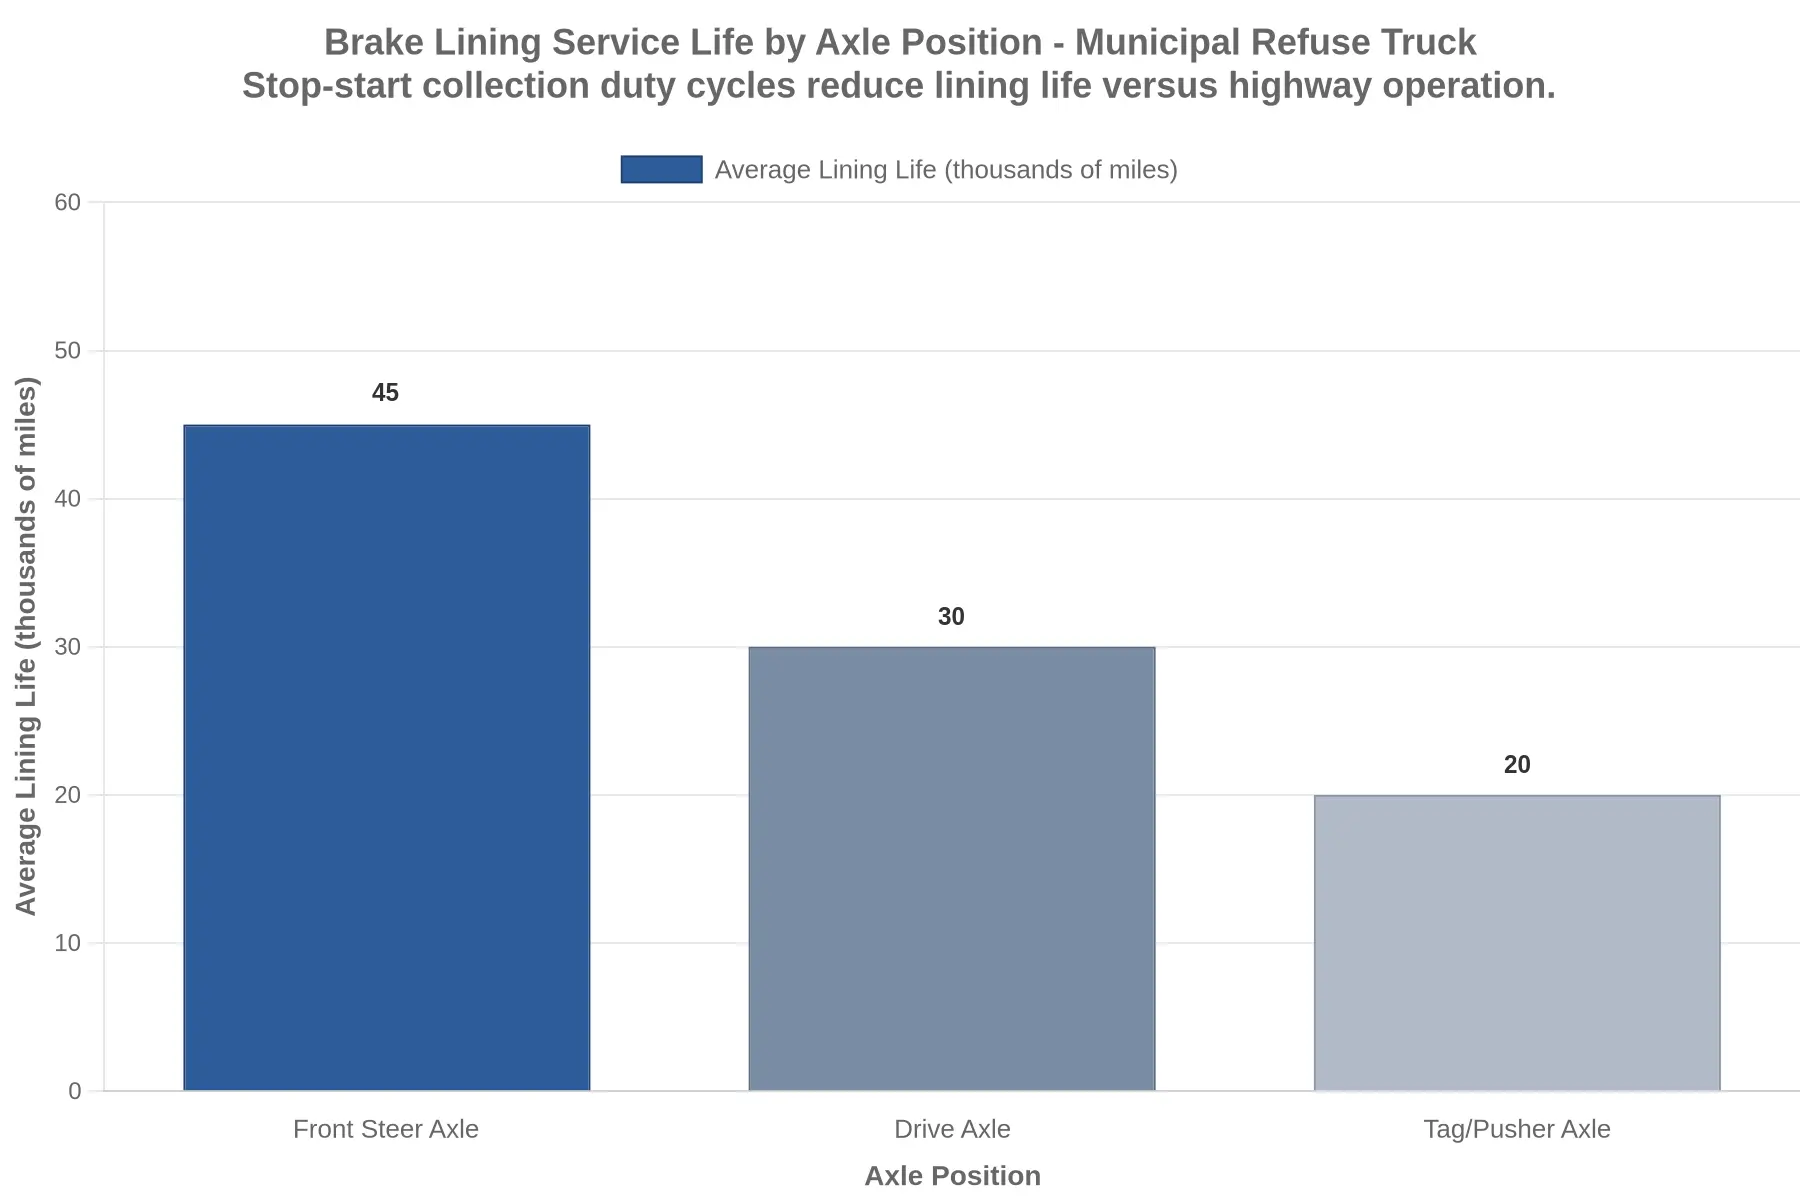
Maintenance discipline closes the loop. A structured brake adjustment program — automatic slack adjusters with verification checks, or disciplined manual schedules — keeps pushrod travel consistent and braking balanced. Tracking component life by axle position, as shown in the chart below, shows whether wear is uniform or concentrated and informs rotation and replacement policy.
Preventive replacement thresholds based on measured friction thickness, not failure, keep trucks in service. Documented wear rates also support procurement and rental decisions, because they justify the specification upgrades that reduce municipal garbage truck brake wear and unplanned downtime across the fleet.
Brake System Wear & Failure Cost Contribution – Municipal Garbage Trucks (Stop-Start Duty Cycle)
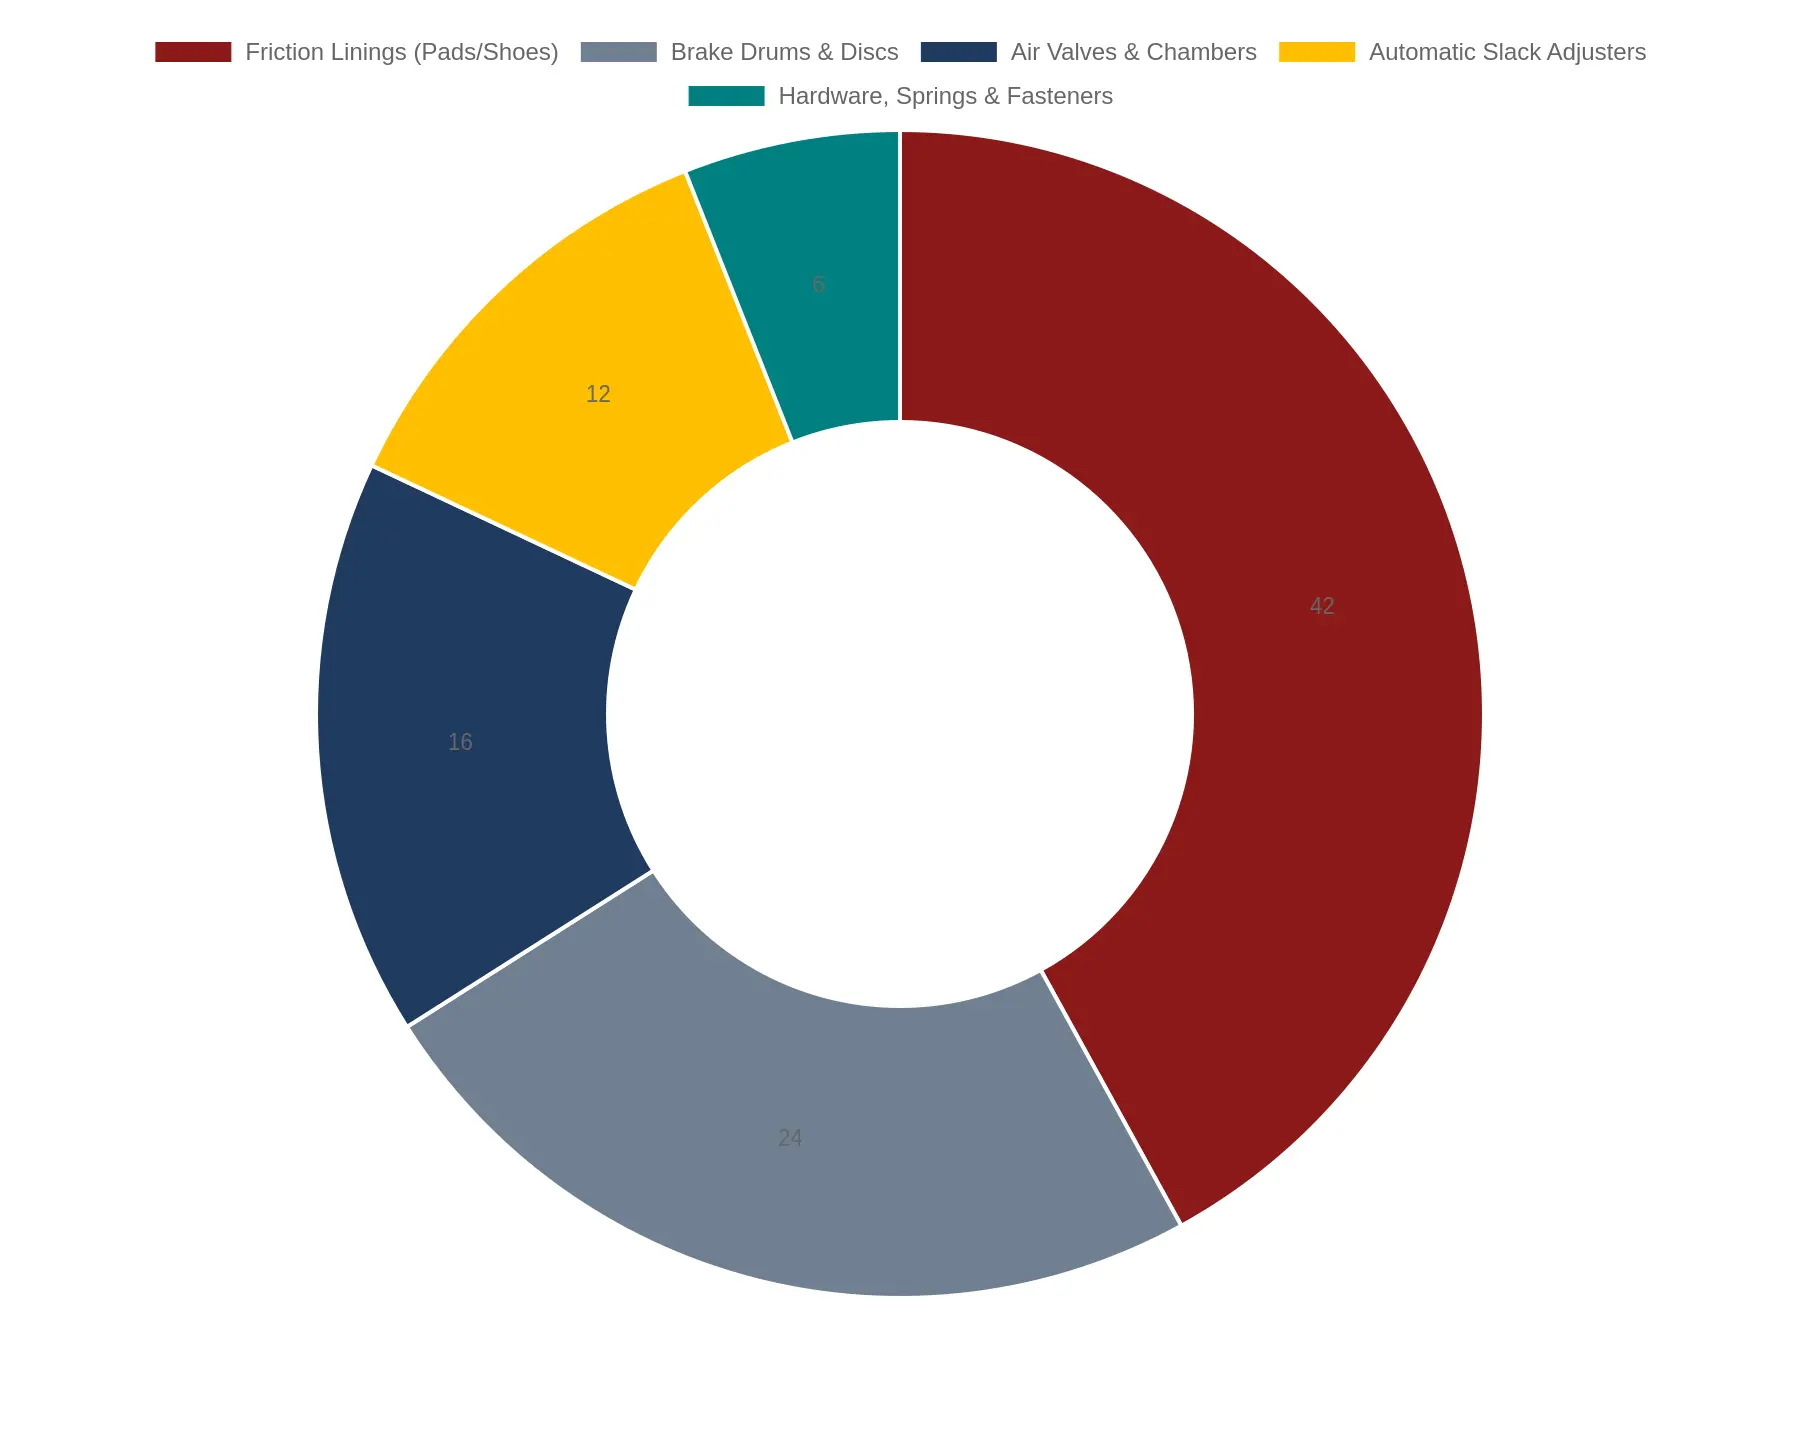
| Component | Contribution to Wear & Failure Cost |
|---|---|
| Friction Linings (Pads/Shoes) | 42% |
| Brake Drums & Discs | 24% |
| Air Valves & Chambers | 16% |
| Automatic Slack Adjusters | 12% |
| Hardware, Springs & Fasteners | 6% |
Caption: Friction material dominates refuse truck brake wear, but air valves, chambers, and slack adjusters collectively account for over a quarter of failure cost under high-frequency stop-start collection routes — making these supporting components a core focus for any refuse truck brake system maintenance program.
Frequently Asked Questions: Municipal Garbage Truck Brake Wear
Why do mileage-based brake service intervals fail for refuse trucks?
Mileage-based intervals assume braking demand scales with distance, and that assumption breaks down on stop-start collection routes. A residential refuse truck may log only 25-40 miles per shift while making 800 to 1,200 brake applications, so distance badly understates thermal and friction loading. Mileage targets then let linings wear past safe limits before the odometer triggers service. Schedule municipal garbage truck brake wear by brake-event counts, engine hours, or route type instead.
Do disc brakes outperform drum brakes in collection duty?
On the front axle, air disc brakes generally beat drums in collection duty: they resist fade, dissipate heat faster, and give shorter, more consistent stops when cycled hundreds of times per shift. Rear axles often keep drums to manage cost, weight, and parking-brake integration, though full-disc setups improve balance on heavy front-loaders. The tradeoff is higher acquisition cost, more dust, and tighter pad-retraction tolerances. Match friction technology to each route’s stop density rather than to a uniform fleet specification.
How do I benchmark normal lining life for a collection fleet?
Segment routes by stop density, payload, and terrain, then record lining thickness at every preventive inspection to build a wear-rate curve for each route class. Convert that curve into brake-events per millimeter or hours per millimeter, which predicts far better than miles. Municipal garbage truck brake wear varies widely between automated side-loaders and rear-loaders, so benchmarks have to be route-specific rather than fleet-wide averages — just as other refuse truck maintenance systems demand component-level tracking. Review the data quarterly, and treat any route more than 20 percent off its class baseline as an inspection priority.
What role does regenerative braking play on electric refuse trucks?
Regenerative braking on electric refuse trucks recovers kinetic energy during deceleration, and on stop-start collection routes those events are frequent, which cuts friction-brake duty and extends lining life. Regen alone rarely brings the truck to a complete stop, though, so low-speed final stops still rely on friction brakes, and cold or fully charged batteries can limit regen authority. How regen blends with friction braking therefore determines real-world wear more than the presence of regen itself. Confirm that brake blending is calibrated for frequent low-speed cycles, not just highway deceleration.
How should I prioritize brake inspection frequency?
Use a risk-based schedule that weights each route by brake-event density, payload, downhill grade, and driver behavior from telematics. Inspect high-frequency stop-start routes at the shortest intervals; transfer and highway segments can follow longer ones. Measuring lining thickness at fixed brake-event milestones rather than elapsed time surfaces wear before it becomes a safety or compliance problem. That concentrates limited shop labor where failure risk is highest.
The dominant force behind municipal garbage truck brake wear is not distance traveled but the stop-start duty cycle compressed into every collection route. A refuse truck that logs only 40 miles in a shift may still make 800 to 1,200 brake applications, each converting kinetic energy into heat that the friction pair has to absorb and dissipate before the next stop. That thermal load, not the odometer, cooks rotors, glazes linings, and accelerates air-system fatigue. Fleets that manage brakes by mileage are measuring the wrong variable.
The engineering follows from there. Because energy dissipation scales with the square of speed and with the frequency of deceleration, a route with dense curbside pickups imposes a very different stress profile than a highway shuttle, even at identical mileage. Maintenance programs built on fixed milemarker intervals end up over-servicing some trucks and under-servicing others. The fix is to instrument the real driver: count brake events, log deceleration cycles, and track caliper and drum temperatures so service intervals reflect actual thermal exposure instead of a proxy that hides it.
In practice, that means moving to cycle-based brake management. Instead of asking how far a truck has traveled, supervisors should ask how many stops it has made, how much heat it has generated, and how quickly it recovered. Those numbers let fleets set condition-based inspection triggers, justify premium friction materials where the duty cycle demands them, and predict wear before it becomes a roadside failure. Over a full replacement cycle, the savings in unplanned downtime and premature replacement add up.
Cycle-based management also reshapes procurement. When a truck is spec’d around the thermal and stopping profile it will actually face, brake capacity, cooling, and lining selection become explicit requirements instead of afterthoughts. As departments plan fleet renewal, tying brake specifications to measured refuse truck brake duty cycle data helps match new assets to the routes they will run. Teams weighing replacement options can review municipal truck inventory and procurement resources to align acquisition timing with these duty-cycle realities. Measure the cycle, not the miles, and brake management becomes predictable.